

基于Arduino构建的4通道实时示波器
描述
示波器是任何电子工程师或制造商的工作台上最重要的工具之一。它主要用于查看波形并确定施加在其输入端的信号的电压电平、频率、噪声和其他参数,这些参数可能会随时间变化。嵌入式软件开发人员还使用它进行代码调试,技术人员使用它在维修期间对电子设备进行故障排除。这些原因使示波器成为任何工程师的必备工具。唯一的问题是它们可能非常昂贵,以最低精度执行最基本功能的示波器可能高达 45 至 100 美元,而更先进和更高效的示波器的成本超过 150 美元。今天,我将演示如何使用Arduino和一款软件,该软件将使用我最喜欢的编程语言Python开发,以构建低成本的4通道Arduino示波器,该示波器能够执行部署一些廉价示波器的任务,例如显示波形和确定信号的电压电平。
工作原理
这个项目有两个部分;
数据转换器
绘图仪
示波器通常涉及施加到其输入通道的模拟信号的视觉表示。为此,我们需要首先将信号从模拟转换为数字,然后绘制数据。对于转换,我们将利用Arduino使用的atmega328p微控制器上的ADC(模数转换器)将信号输入的模拟数据转换为数字信号。转换后,每次的值通过UART从Arduino发送到PC,在那里,将使用python开发的绘图仪软件将通过绘制每个数据与时间的关系将传入的数据流转换为波形。
必需组件
生成此项目需要以下组件;
Arduino Uno(可以使用任何其他板)
面包板
10k 电阻器 (1)
LDR (1)
跳线
所需软件
Arduino IDE
蟒
Python 库:Pyserial、Matplotlib、Drawnow
图表
Arduino示波器的原理图很简单。我们需要做的就是将要检查的信号连接到Arduino的指定模拟引脚。但是,我们将在简单的分压器设置中使用LDR来生成要检查的信号,以便生成的波形将根据LDR周围的光强度描述电压电平。
按照下面的原理图连接组件;
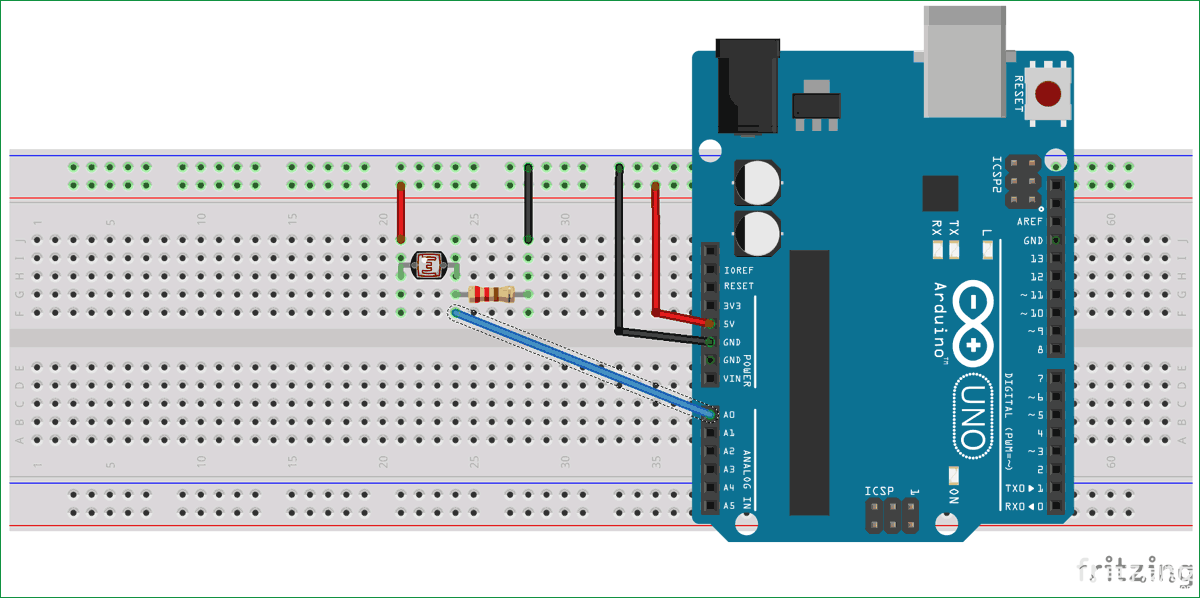
连接后,设置应如下图所示。
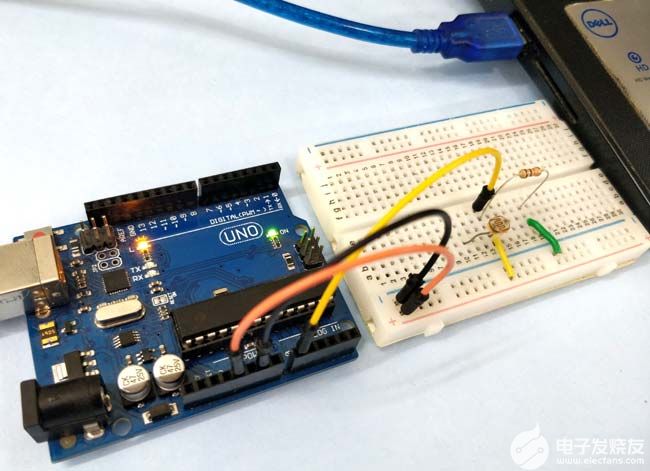
完成所有连接后,我们可以继续编写代码。
Arduino Osclloscope Code
我们将为这两个部分中的每一个编写代码。对于前面提到的绘图仪,我们将编写一个python脚本,通过UART和Plots接受来自Arduino的数据,而对于转换器,我们将编写一个Arduino草图,该草图从ADC接收数据并将其转换为发送到绘图仪的电压电平。
Python(绘图仪)脚本
由于 python 代码更复杂,我们将从它开始。
我们将使用几个库,包括;drawnow,Matplotlib和Pyserial使用前面提到的python脚本。Pyserial 允许我们创建一个可以通过串行端口进行通信的 python 脚本,Matplotlib 使我们能够从通过串行端口接收的数据生成绘图,drawnow 为我们提供了一种实时更新绘图的方法。
有几种方法可以在您的 PC 上安装这些软件包,最简单的是通过pip。Pip 可以通过命令行安装在 Windows 或 Linux 机器上。PIP 与 python3 打包在一起,所以我建议您安装 python3 并选中有关将 python 添加到路径的框。如果您在安装 pip 时遇到问题,请查看 Python 官方网站以获取提示。
安装 pip 后,我们现在可以安装所需的其他库。
打开Windows用户的命令提示符,Linux用户的终端,然后输入以下内容;
pip install pyserial
完成此操作后,请使用以下命令安装 matplotlib;
pip install matplotlib
Drawnow 有时与 matplotlib 一起安装,但可以肯定的是,运行;
pip install drawnow
安装完成后,我们现在可以编写 python 脚本了。
我们首先导入代码所需的所有库;
import time import matplotlib.pyplot as plt from drawnow import *
import pyserial
接下来,我们创建并初始化将在代码期间使用的变量。数组 val 将用于存储从串行端口接收的数据,cnt 将用于计数。每 50 个数据计数后,位置 0 处的数据将被删除。这样做是为了保持示波器上显示的数据。
val = [ ] cnt = 0
接下来,我们创建串行端口对象,Arduino 将通过该对象与我们的 python 脚本进行通信。确保下面指定的 COM 端口与 Arduino 板与 IDE 通信的 COM 端口相同。上面使用的115200波特率用于确保与Arduino的高速通信。为防止错误,还必须启用 Arduino 串行端口才能与此波特率通信。
port = serial.Serial('COM4', 115200, timeout=0.5)
接下来,我们使用;
plt.ion()
我们需要创建一个函数来从收到的数据生成绘图,创建我们期望的上限和最小限制,在这种情况下,基于 Arduino's ADC 的分辨率为 1023。我们还设置了标题,标记了每个轴并添加了图例,以便于识别情节。
#create the figure function def makeFig(): plt.ylim(-1023,1023) plt.title('Osciloscope') plt.grid(True) plt.ylabel('ADC outputs') plt.plot(val, 'ro-', label='Channel 0') plt.legend(loc='lower right')
完成此操作后,我们现在准备编写主循环,该循环在可用时从串行端口获取数据并绘制它。为了与Arduino同步,python脚本将握手数据发送到Arduino,以指示其准备读取数据。当Arduino收到握手数据时,它会回复来自ADC的数据。没有这种握手,我们将无法实时绘制数据。
while (True):
port.write(b's') #handshake with Arduino
if (port.inWaiting()):# if the arduino replies
value = port.readline()# read the reply
print(value)#print so we can monitor it
number = int(value) #convert received data to integer
print('Channel 0: {0}'.format(number))
# Sleep for half a second.
time.sleep(0.01)
val.append(int(number))
drawnow(makeFig)#update plot to reflect new data input
plt.pause(.000001)
cnt = cnt+1
if(cnt>50):
val.pop(0)#keep the plot fresh by deleting the data at position 0
Arduino 代码
第二个代码是Arduino草图,用于从ADC获取表示信号的数据,然后等待从绘图仪软件接收握手信号。一旦收到握手信号,它就会通过UART将采集的数据发送到绘图仪软件。
我们首先声明将应用信号的Arduino模拟引脚的引脚。
int sensorpin = A0;
接下来,我们初始化并开始波特率为 115200 的串行通信
void setup() {
// initialize serial communication at 115200 bits per second to match that of the python script:
Serial.begin(115200);
}
最后,voidloop() 函数处理数据的读取,并通过串行将数据发送到绘图仪。
void loop() {
// read the input on analog pin 0:
float sensorValue = analogRead(sensorpin);
byte data = Serial.read();
if (data == 's')
{
Serial.println(sensorValue);
delay(10); // delay in between reads for stability
}
}
完整的 Arduino 示波器代码在下面以及本文末尾给出,如下所示。
int sensorpin = A0;
void setup() {
// initialize serial communication at 115200 bits per second to match that of the python script:
Serial.begin(115200);
}
void loop() {
// read the input on analog pin 0:########################################################
float sensorValue = analogRead(sensorpin);
byte data = Serial.read();
if (data == 's')
{
Serial.println(sensorValue);
delay(10); // delay in between reads for stability
}
}
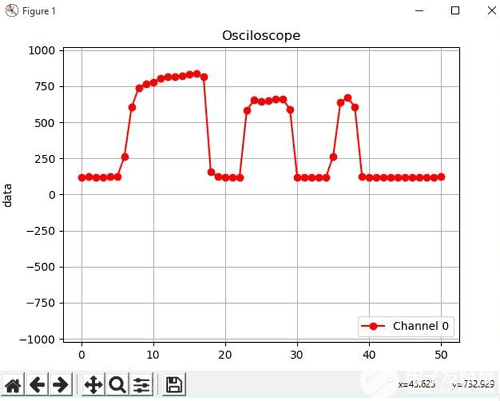
Arduino 示波器的实际应用
将代码上传到Arduino设置并运行python脚本。您应该看到数据开始通过python命令行流入,并且绘图随光强度而变化,如下图所示。
Python Code:
import time
import matplotlib.pyplot as plt
from drawnow import *
import serial
val = [ ]
cnt = 0
#create the serial port object
port = serial.Serial('COM4', 115200, timeout=0.5)
plt.ion()
#create the figure function
def makeFig():
plt.ylim(-1023,1023)
plt.title('Osciloscope')
plt.grid(True)
plt.ylabel('data')
plt.plot(val, 'ro-', label='Channel 0')
plt.legend(loc='lower right')
while (True):
port.write(b's') #handshake with Arduino
if (port.inWaiting()):# if the arduino replies
value = port.readline()# read the reply
print(value)#print so we can monitor it
number = int(value) #convert received data to integer
print('Channel 0: {0}'.format(number))
# Sleep for half a second.
time.sleep(0.01)
val.append(int(number))
drawnow(makeFig)#update plot to reflect new data input
plt.pause(.000001)
cnt = cnt+1
if(cnt>50):
val.pop(0)#keep the plot fresh by deleting the data at position 0
Arduino Code:
int sensorpin = A0;
void setup() {
// initialize serial communication at 115200 bits per second to match that of the python script:
Serial.begin(115200);
}
void loop() {
// read the input on analog pin 0:########################################################
float sensorValue = analogRead(sensorpin);
byte data = Serial.read();
if (data == 's')
{
Serial.println(sensorValue);
delay(10); // delay in between reads for stability
}
}
-
四通道示波器2014-08-26 0
-
用gokit2的arduino底板做漂亮的4通道示波器和信号发生器2017-05-12 0
-
USB八通道示波器2017-08-02 0
-
8通道示波器助力电源排序检验更轻松2018-10-17 0
-
在Multisim平台中使用四通道示波器问题2018-11-21 0
-
AD5726多路DAC输出 SPI写进去的控制字只有1通道与4通道有效2018-11-30 0
-
求购TO2044 数字示波器.4 GHz的4通道2021-03-08 0
-
北京泰克TDS3034C|TDS3034C-300M、4通道示波器2021-05-09 0
-
租售TDS3054C采样5.0GS/s|4通道TDS3054C示波器2021-05-09 0
-
8通道示波器有什么作用?为什么选择它?2021-06-08 0
-
美国Tektronix泰克DPO3054 500MHz 4通道 数字示波器2021-08-20 0
-
Multisim的双通道示波器和四通道示波器使用方法2023-04-27 0
-
力科推出 4通道均为30GHz的实时示波器解决方案2010-02-08 864
-
Arduino LCD触摸屏双通道示波器2023-02-03 274
-
基于Arduino的双通道示波器2023-02-03 1847
全部0条评论

快来发表一下你的评论吧 !
