

NanoBeacon™ BLE扫描器教程(第四部分)
描述
So far, we have published three tutorials on using our new NanoBeacon BLE Scanner mobile app. We covered the following topics:
到目前为止,我们已经发布了三个关于使用我们新的NanoBeacon BLE扫描器移动应用程序的教程。我们涵盖了以下主题:
- Introduction to the NanoBeacon BLE Scanner mobile app
- NanoBeacon BLE扫描器移动应用程序介绍
- Installation and setup
- 安装和设置
- Overview of the different features of the app
- 该应用程序的不同功能概述
- How to use the mobile app to discover your IN100 tags
- 如何使用移动应用程序来发现您的IN100标签
- Overview of device filters
- 设备过滤器的概述
- The differences between the iOS app and the Android app
- iOS应用程序和Android应用程序之间的差异
- App notifications for detecting triggered advertising sets
- 检测触发的广播集的应用程序通知
In this tutorial, we will cover the “Logs” and “Monitor” features of the mobile app (available in the latest version of the app)
在本教程中,我们将介绍移动应用程序的 "日志 "和 "监控 "功能(在应用程序的最新版本中可用)。
Let’s get started!
让我们开始吧!
Logging Feature 记录功能
First, make sure you have the latest version of the app (whether that’s for iOS or Android).
首先,确保你有最新版本的应用程序(无论是iOS还是Android)。
Once you have the latest version installed, go ahead and launch the app.
一旦你安装了最新版本,就去启动该应用程序。
For a simple test case, we’ll be configuring the IN100 with the following parameters:
对于一个简单的测试案例,我们将用以下参数配置IN100:
- One advertising set
- 一个广播集
- Advertising Data
- 广播数据
- Advertising data format: Custom
- 广播数据格式:自定义
- Device Name: “IN100”
- 设备名称:"IN100"
- Manufacturer Specific Data: VCC, Internal Temp
- 制造商特定数据:VCC,内部温度
- Advertising Parameters
- 广播参数
- Advertising Interval: 100 ms
- 广播间隔:100毫秒
Once you have the parameters set as above, make sure you probe and connect to the device, then click “Run in RAM.”
一旦你设置了上述参数,确保你探测并连接到设备,然后点击 "在RAM中运行"。
Finally, import your IN100 configuration from NanoBeacon Config Tool (via the QR code) into the mobile app.
最后,将你的IN100配置从NanoBeacon配置工具(通过QR码)导入移动应用程序。
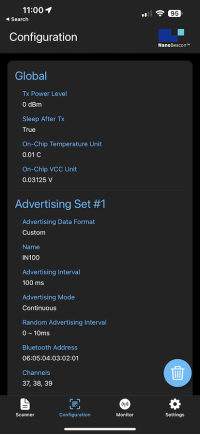
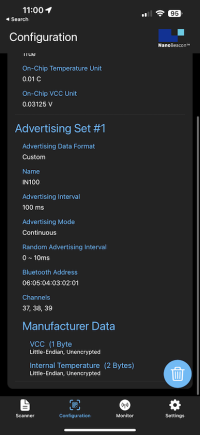
Now that we have the configuration imported into the mobile app, we should see the following in the “Configuration” view:
现在我们已经将配置导入移动应用程序,我们应该在 "配置 "视图中看到以下内容:
Verify that the configuration is correct, and then navigate to the “Scanner” view.
验证配置是否正确,然后导航到 "扫描器 "视图。
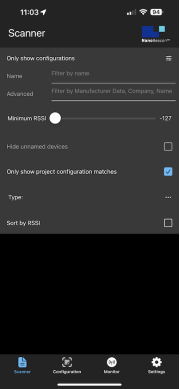
Once in the Scanner view, enable the filter “Only show project configuration matches”:
一旦进入 "扫描器 "视图,启用过滤器 "只显示项目配置匹配":
Now, exit the filter view and refresh the scan. You should see the following on screen:
现在,退出过滤器视图并刷新扫描。你应该在屏幕上看到以下内容:
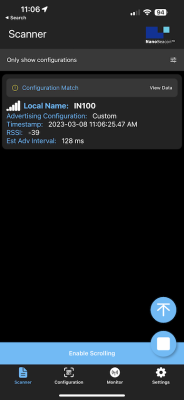
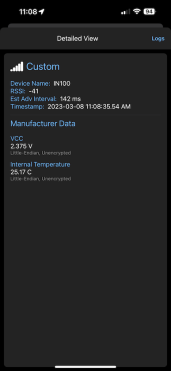
Now, click on the “View Data” text to see the detailed real-time advertising data:
现在,点击 "查看数据 "文本,查看详细的实时广播数据:
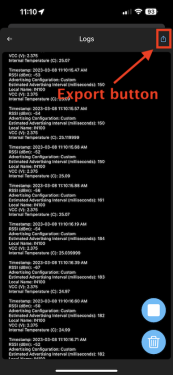
From here, notice the “Logs” button in the top right corner of the screen. Click on it, and now you should see a real-time log of the captured data. Basically, this shows the history of all the advertising data captured by the app. Once in this view, you’ll also notice that there’s an export button in the top right-hand corner of the screen:
在这里,注意屏幕右上角的 "日志 "按钮。点击它,现在你应该看到捕获数据的实时日志。基本上,这显示了该应用程序捕获的所有广播数据的历史。一旦进入这个视图,你还会注意到,在屏幕的右上角有一个导出按钮:
This allows you to export the full log via email, clipboard, and other methods supported by your device:
这允许你通过电子邮件、剪贴板和你的设备支持的其他方法导出完整的日志:
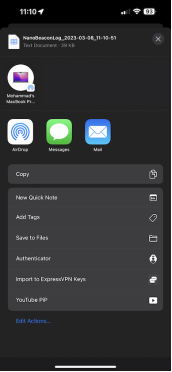
The exported format is in CSV (comma-separated values), so you can easily import it into Excel or any other spreadsheet app you choose.
导出的格式是CSV(omma-separated values),所以你可以很容易地把它导入Excel或你选择的任何其他电子表格应用程序。
You’ll also notice two other icons in the bottom right-hand corner of the screen, the trash icon() and the stop icon ( ). These allow you to stop/continue/start the logging and also clear the logs, respectively.
你还会注意到屏幕右下角的另外两个图标,即垃圾箱图标()和停止图标。和停止图标()。这两个图标分别允许你停止/继续/启动日志记录,也可以清除日志。
Here’s what the exported log data looks like in Excel:
下面是导出的日志数据在Excel中的样子:
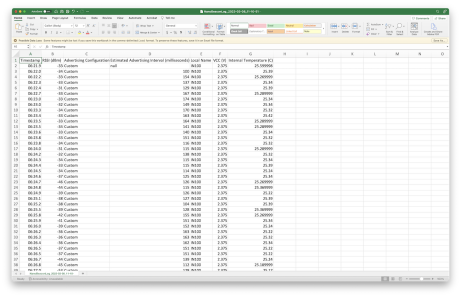
As you can see, this is a very powerful feature that allows you to take your data outside the app and perform any data analysis you wish!
正如你所看到的,这是一个非常强大的功能,允许你把你的数据带到应用程序之外,并执行任何你想要的数据分析!
Now, this is great for continuous advertising data sets where you’ll always find the advertising set captured by the mobile app, but what about triggered advertising sets (if you’re unfamiliar with the concept of Triggered advertising sets in NanoBeacon, I encourage you to read our last tutorial on the topic, found here).
现在,这对连续的广播数据集来说是很好的,你总能找到由移动应用程序捕获的广播集,但触发的广播集呢(如果你不熟悉NanoBeacon中触发的广播集的概念,我鼓励你阅读我们关于这个主题的最后一个教程,在这里找到)。
Let’s see how we can view logs for triggered advertising sets!
让我们看看如何查看被触发的广播集的日志!
Monitor View 监控视图
If you’ve used previous versions of the mobile app, you’ll notice that this is a new view that was just added recently.
如果你使用过以前版本的移动应用程序,你会注意到这是最近刚添加的一个新视图。
The view allows you to see the last captured advertising data sets as well as the history/logs of the captured data. This can be very powerful, especially in the case of Triggered advertising sets, where the advertising sets are not always present. It is also a much more convenient way to view the logs for all configured advertising sets outside of the Scanner view.
该视图允许你看到最后捕获的广播数据集,以及捕获数据的历史/日志。这可能是非常强大的,特别是在触发式广播集的情况下,广播集并不总是存在。这也是一个更方便的方法,可以在扫描器视图之外查看所有配置的广播集的日志。
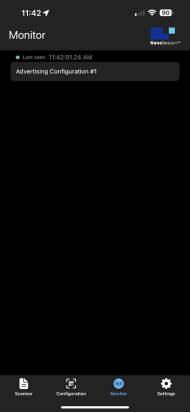
For our configuration example that we used in this tutorial, if we navigate to the Monitor view, we’ll notice the single advertising set that we configured:
对于我们在本教程中使用的配置例子,如果我们导航到监视器视图,我们会注意到我们配置的单一广播集:
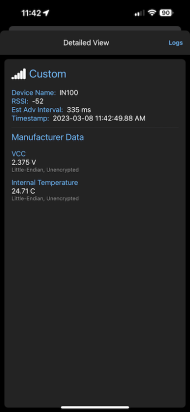
If we click on it, we’ll be taken to a view that’s identical to the one found when you click on “View Data” in the Scanner view. The data shown here is updated in real-time:
如果我们点击它,我们将被带到一个与你在扫描器视图中点击 "查看数据 "时发现的相同的视图。这里显示的数据是实时更新的:
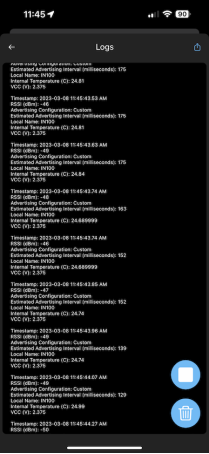
You’ll also notice you have the “Logs” button which will allow you to view the history of the data captured by the mobile app:
你还会注意到你有 "日志 "按钮,这将使你能够查看移动应用程序捕获的数据的历史:
One cool experiment to run is to turn off your IN100 device (or simply take it out of range), verify that the device is no longer being discovered in the Scanner view, and then navigate to the Monitor view to see the log data for the advertising set.
一个很酷的实验是关闭你的IN100设备(或者干脆把它带出范围),在扫描器视图中验证该设备不再被发现,然后导航到监视器视图,查看广播集的日志数据。
You’ll also be able to see the data included in the last-captured advertising set and see the timestamp it was captured at.
你还可以看到最后捕获的广播集所包含的数据,并看到它被捕获的时间戳。
Summary 总结In this tutorial, we focused on the Logging feature of the app and showed how you can view the logs in two ways:
在本教程中,我们重点介绍了应用程序的日志功能,并展示了如何以两种方式查看日志:
- From the Scanner view —> View Data —> Logs
- 从扫描器视图->查看数据->日志
- From Monitor view —> click on Advertising Set of interest —> Logs
- 从监控视图->点击感兴趣的广播集->日志
Stay tuned for more tutorials covering new features that get added to the mobile app!
请继续关注更多涵盖移动应用程序新增功能的教程!
-
独特的51单片机教程第四部分—牛人经验,论坛独家奉献2011-11-21 0
-
【蓝牙4.1】+ 分享一本好书《Psoc 体系结构与编程》四部分完全版2015-06-11 0
-
ISO/IEC14443标准包括哪几个部分2021-07-29 0
-
火力发电厂水汽分析方法 第四部分:氯化物的测定 (电极法)D2009-06-08 432
-
2012年PSoC数模混合设计培训_第四部分2017-10-27 586
-
NanoBeacon™ BLE扫描器教程(第一部分)2023-05-25 529
-
NanoBeacon™ BLE扫描器教程(第二部分)2023-05-31 432
-
NanoBeacon™ BLE扫描器教程(第四部分)2023-06-02 329
-
NanoBeacon™ BLE扫描器教程2023-06-02 453
-
硬件即代码第四部分:嵌入式RAM2023-06-14 209
-
NanoBeacon™ BLE扫描器移动应用程序上架应用宝2023-05-22 305
全部0条评论

快来发表一下你的评论吧 !
