

Prometheus实战篇:Exporter知识概述
描述
概述
所有可以向Prometheus提供监控样本数据的程序都可以被称为一个Exporter.而Exporter的一个实例称为target,如图下所示,
Prometheus通过轮询的方式定期从这些target中获取样本数据: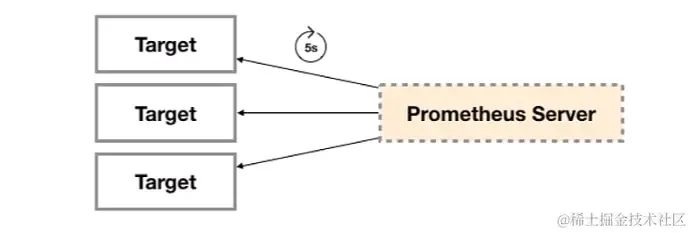
这里Prometheus是通过pull(拉取的方式)从Target中获取样本数据
安装好Exporter后会暴露一个/metrics的HTTP服务,通过Prometheus添加配置Prometheus就可以采集到这个/metrics里面的所有监控样本数据
- targets: ['node_exporter:9100'] 会自动带上/metrics
Exporter的来源
从exporter的来源上来讲,一共分俩类:
社区提供的
社区提供 (prometheus.io/docs/instru…)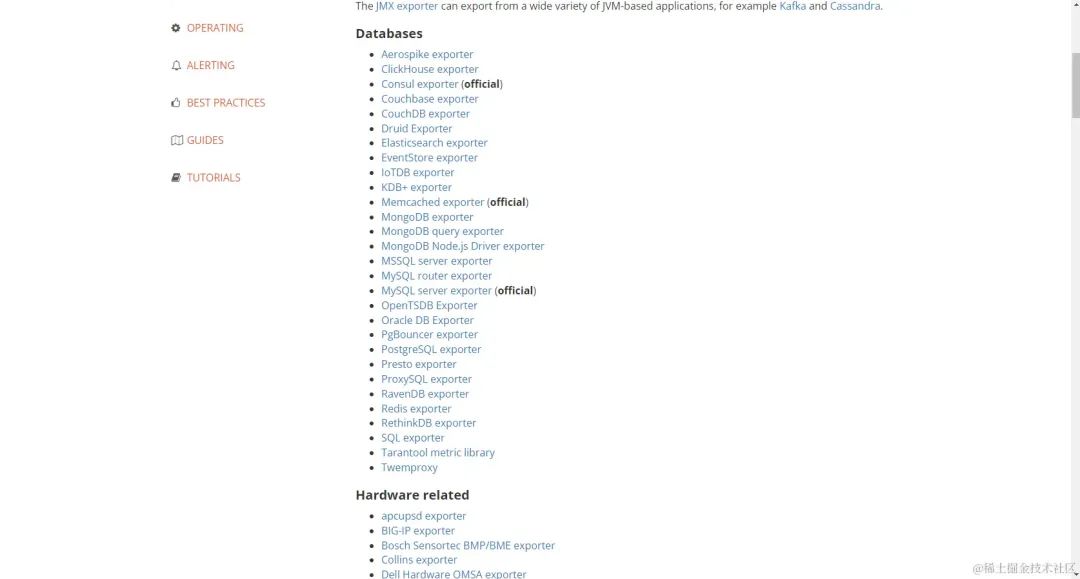
Prometheus社区提供了丰富的Exporter实现,涵盖了从基础设施,中间件一级网络等各个方面的监控功能.这些Exporter可以实现大部分通用的监控需求.下表列举一些社区中常用的Exporter:
| 使用范围 | 常用的Exporter |
|---|---|
| 数据库 | MySQL Exporter,RedisExporter,MongDB Exporter,MSSQL Exporter等 |
| 硬件 | Apcupsd Exporter,IoT Edison Exporter,IPMI Exporter等 |
| 消息队列 | Kafka Exporter,RabbitMQ Exporter,NSQ Exporter等 |
| 存储 | Ceph Exporter,Gluster Exporter,HDFS Exporter,等 |
| HTTP服务 | Apache Exporter,HAProxy Exporter,Nginx Exporter等 |
| API服务 | AWS Exporter,Docker Cloud Exporter,Docker Hub Exporter,GitHub Exporter等 |
| 日志 | Flue Exporter,Grok Exporter等 |
| 监控系统 | Collectd Exporter,Graphite Exporter,InfluxDB Exporter,Nagios Exporter等 |
| 其他 | Blockbox Exporter,JIRA Exporter,Jenkins Exporter,Confluence Exporter等 |
用户自定义
除了直接使用社区提供的Exporter程序意外,用户还可以基于Prometheus提供的Client Library创建自己的Exporter程序,目前Prometheus社区官方提供了对以下编程语言的支持:Go,java,Python,Ruby.同事还有第三方实现的如:Bash,C++,Common Lisp,Erlang,Haskeel,Lua,Node.js,PHP,Rust等.
Exporter类型
通常来说可以将Exporter分为俩类
直接采集型 这类Exporter直接内置了相应的应用程序,用于向Prometheus直接提供Target数据支持.这样设计的好处是,可以更好的监控各自系统的内部运行状态,同时也适合更多自定义监控指标的项目实施.例如k8s 等.他们均内置了用于Prometheus提供监控数据的端点.
间接采集型 原始监控目标并不直接支持Prometheus,需要我们使用Prometheus提供的Client Library编写该监控目标的监控采集程序,用户可以将该程序独立运行,去获取指定的各类监控数据值.例如,由于Linux操作系统自身并不能直接支持Prometheus.用户无法从操作系统层面上直接提供对Prometheus的支持,因此单独安装Node Exporter,还有数据库或网站HTTP应用类等Exporter.
Exporter规范
所有的Exporter程序都需要按照Prometheus的规范,返回监控的样本数据.以Node Exporter为例,当访问/metrics结尾地址时会返回一下内容:
go_gc_duration_seconds{quantile="0"} 4.029e-05
go_gc_duration_seconds{quantile="0.25"} 5.2092e-05
go_gc_duration_seconds{quantile="0.5"} 6.3091e-05
go_gc_duration_seconds{quantile="0.75"} 8.9905e-05
go_gc_duration_seconds{quantile="1"} 0.000300032
go_gc_duration_seconds_sum 2.6172319120000003
go_gc_duration_seconds_count 36170


go_goroutines 9


go_info{version="go1.19.3"} 1


go_memstats_alloc_bytes 2.19788e+06
以#开头的行通常都是注释内容,这些样本数据集合说明如下:
以#HELP开始的行,表示metric的帮助与说明注释,可以包含当前监控指标名称和对应的说明信息.
以#TYPE开始的行,表示定义metric类型,可以包含当前监控指标名称和类型,类型有Counter,Gauge....
非#开头的行,就是监控样本数据
样本数据如何存储Prometheus的库中
go_memstats_alloc_bytes 2.19788e+06


go_memstats_alloc_bytes{instance="localhost:9090", job="prometheus"} timestamp(时间戳) value(样本值)
链接:https://juejin.cn/post/7315240062651023401
审核编辑:刘清
-
《HELLO+FPGA》-+项目实战篇2017-09-27 0
-
prometheus做监控服务的整个流程介绍2020-12-23 0
-
【电子书】《HELLO FPGA》- 项目实战篇2021-04-06 0
-
《HarmonyOS原子化服务卡片原理与实战》清华大学出版社李洋著2022-12-29 0
-
笔记本无线上网之实战篇2010-01-18 328
-
项目实战篇2016-08-08 668
-
刘润5分钟商学院之实战篇电子版下载2021-09-03 1250
-
关于Prometheus监控系统相关的知识体系2022-10-20 911
-
prometheus下载安装教程2023-01-13 6961
-
基于Prometheus开源的完整监控解决方案2023-10-18 196
全部0条评论

快来发表一下你的评论吧 !
