
资料下载


×
使用LabVIEW数字波形图显示一个数字信号的步骤详细说明
消耗积分:0 |
格式:rar |
大小:0.02 MB |
2019-12-05
分享资料个
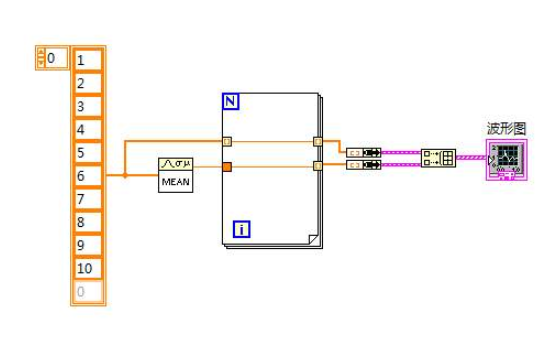
用digital waveform graph 显示一个数字信号的步骤
1.采集一个数字信号。
2.构建一个包含下列对象的前面板。
Digital waveform graph
Digital control, located on the Controls numeric palette, with representation of R64 and a label of X0.
Digital control with representation of R64 and a label of dx. Enter a value of at least 》0.
Digital control with representation of I16 and a label of Ports. Enter a value of 1.
3.在框图上设置一个 包括4个入口的Bundle 函数。
声明:本文内容及配图由入驻作者撰写或者入驻合作网站授权转载。文章观点仅代表作者本人,不代表电子发烧友网立场。文章及其配图仅供工程师学习之用,如有内容侵权或者其他违规问题,请联系本站处理。 举报投诉
评论(0)
发评论
- 相关下载
- 相关文章


