

创建点云数据的Birdseye视图
描述
点云数据——The Point Cloud Data
点云数据应表示为具有N行和至少3列的numpy数组。每行对应于单个点,其在空间(x,y,z)中的位置使用至少3个值表示。
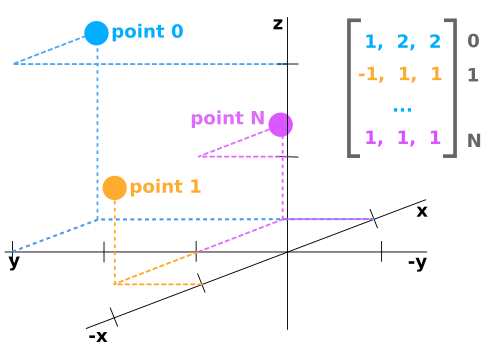
如果点云数据来自LIDAR传感器,那么它可能具有每个点的附加值,例如“反射率”,其是在该位置中障碍物反射多少激光光束的量度。在这种情况下,点云数据可能是Nx4阵列。
图像与点云坐标——Image vs Point Cloud Coordinates
点云的轴与图像中的轴具有完全不同的含义。下图显示了蓝色的图像轴和橙色的点云轴。
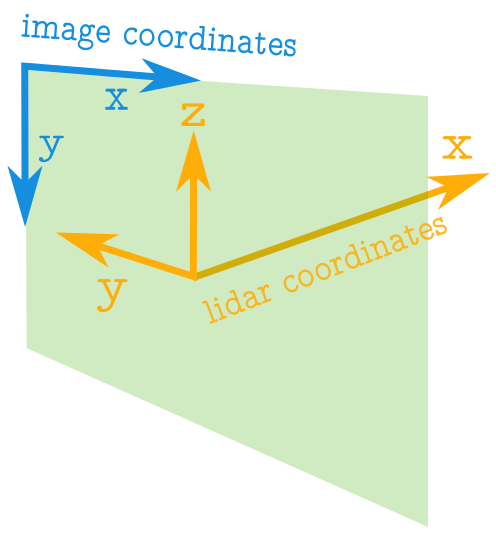
关于图像需要注意的一些重要事项:
图像中的坐标值始终为正。
原点位于左上角。
坐标是整数值。
有关点云坐标的注意事项:
点云中的坐标值可以是正数或负数。
坐标可以采用实数值。
正x轴表示向前。
正y轴表示左。
正z轴表示向上。
创建点云数据的Birdseye视图
鸟瞰图的相关轴
为了创建鸟眼视图图像,来自点云数据的相关轴将是x和y轴。
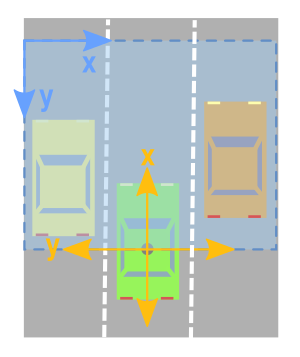
但是,正如我们从上图所示,我们必须小心并考虑以下事项:
x和y轴意味着相反的事情。
x和y轴指向相反的方向。
您必须移动值,以便(0,0)是图像中可能的最小值。
1.限制矩形看——Limiting Rectangle to Look at
仅关注点云的特定区域通常很有用。因此,我们希望创建一个仅保留我们感兴趣的区域内的点的过滤器。
由于我们正在查看顶部的数据,并且我们有兴趣将其转换为图像,因此我将使用与图像轴更加一致的方向。下面,我指定我想要集中在相对于原点的值的范围。原点左侧的任何内容都将被视为负数,而右侧的任何内容都将被视为正数。点云的x轴将被解释为向前方向(这将是我们的鸟眼图像的向上方向)。
下面的代码将感兴趣的矩形设置为在原点的两侧跨越10米,并在其前面20米处。
side_range=(-10, 10) # left-most to right-mostfwd_range=(0, 20) # back-most to forward-most
2.接下来,我们创建一个过滤器,仅保留实际位于我们指定的矩形内的点。
# EXTRACT THE POINTS FOR EACH AXISx_points = points[:, 0]y_points = points[:, 1]z_points = points[:, 2] # FILTER - To return only indices of points within desired cube# Three filters for: Front-to-back, side-to-side, and height ranges# Note left side is positive y axis in LIDAR coordinatesf_filt = np.logical_and((x_points > fwd_range[0]), (x_points < fwd_range[1]))s_filt = np.logical_and((y_points > -side_range[1]), (y_points < -side_range[0]))filter = np.logical_and(f_filt, s_filt)indices = np.argwhere(filter).flatten() # KEEPERSx_points = x_points[indices]y_points = y_points[indices]z_points = z_points[indices]
3.将点位置映射到像素位置——Mapping Point Positions to Pixel Positions
目前,我们有一堆带有实数值的点。为了映射这些值,将这些值映射到整数位置值。我们可以天真地将所有x和y值整合到整数中,但我们最终可能会失去很多分辨率。例如,如果这些点的测量单位是以米为单位,则每个像素将表示点云中1x1米的矩形,我们将丢失任何小于此的细节。如果你有一个类似山景的点云,这可能没问题。但是如果你想能够捕捉更精细的细节并识别人类,汽车,甚至更小的东西,那么这种方法就没有用了。 但是,可以稍微修改上述方法,以便我们获得所需的分辨率级别。在对整数进行类型转换之前,我们可以先扩展数据。例如,如果测量单位是米,我们想要5厘米的分辨率,我们可以做如下的事情:
res = 0.05# CONVERT TO PIXEL POSITION VALUES - Based on resolutionx_img = (-y_points / res).astype(np.int32) # x axis is -y in LIDARy_img = (-x_points / res).astype(np.int32) # y axis is -x in LIDAR
您会注意到x轴和y轴交换,方向反转,以便我们现在可以开始处理图像坐标。
更改坐标原点——Shifting to New Origin
x和y数据仍未准备好映射到图像。我们可能仍然有负x和y值。所以我们需要将数据移位到(0,0)最小值。
# SHIFT PIXELS TO HAVE MINIMUM BE (0,0)# floor and ceil used to prevent anything being rounded to below 0 after shiftx_img -= int(np.floor(side_range[0] / res))y_img += int(np.ceil(fwd_range[1] / res))
现在数据值都为正值
>>> x_img.min()7>>> x_img.max()199>>> y_img.min()1>>> y_img.max()199
像素值——Pixel Values
我们已经使用点数据来指定图像中的x和y位置。我们现在需要做的是指定我们想要用这些像素位置填充的值。一种可能性是用高度数据填充它。要做的两件事 请记住: 像素值应为整数。 像素值应该是0-255范围内的值。 我们可以从数据中获取最小和最大高度值,并重新缩放该范围以适应0-255的范围。另一种方法,这里将使用的方法是设置我们想要集中的高度值范围,并且高于或低于该范围的任何内容都被剪切为最小值和最大值。这很有用,因为它允许我们从感兴趣的区域获得最大量的细节。
height_range = (-2, 0.5) # bottom-most to upper-most # CLIP HEIGHT VALUES - to between min and max heightspixel_values = np.clip(a = z_points, a_min=height_range[0], a_max=height_range[1])
在下面的代码中,我们将范围设置为原点下方2米,高于原点半米。接下来,我们将这些值重新缩放到0到255之间,并将类型转换为整数。
def scale_to_255(a, min, max, dtype=np.uint8): """ Scales an array of values from specified min, max range to 0-255 Optionally specify the data type of the output (default is uint8) """ return (((a - min) / float(max - min)) * 255).astype(dtype) # RESCALE THE HEIGHT VALUES - to be between the range 0-255pixel_values = scale_to_255(pixel_values, min=height_range[0], max=height_range[1])
创建图像阵列——Create the Image Array
现在我们准备实际创建图像,我们只是初始化一个数组,其尺寸取决于我们在矩形中所需的值范围和我们选择的分辨率。然后我们使用我们转换为像素位置的x和y点值来指定数组中的索引,并为这些索引分配我们选择的值作为前一小节中的像素值。
# INITIALIZE EMPTY ARRAY - of the dimensions we wantx_max = 1+int((side_range[1] - side_range[0])/res)y_max = 1+int((fwd_range[1] - fwd_range[0])/res)im = np.zeros([y_max, x_max], dtype=np.uint8) # FILL PIXEL VALUES IN IMAGE ARRAYim[y_img, x_img] = pixel_values
预览——Viewing
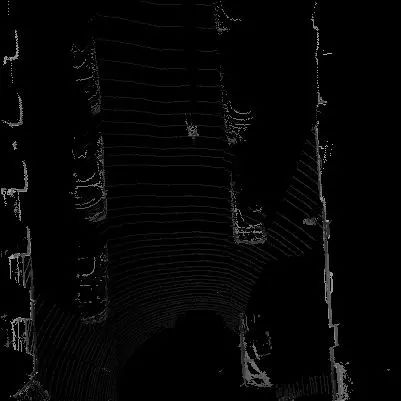
目前,图像存储为numpy数组。如果我们希望将其可视化,我们可以将其转换为PIL图像,并查看它。
# CONVERT FROM NUMPY ARRAY TO A PIL IMAGEfrom PIL import Imageim2 = Image.fromarray(im)im2.show()
我们作为人类并不善于分辨灰色阴影之间的差异,因此它可以帮助我们使用光谱颜色映射来让我们更容易分辨出价值差异。我们可以在matplotlib中做到这一点。(实际无法正常显示)
import matplotlib.pyplot as pltplt.imshow(im, cmap="spectral", vmin=0, vmax=255)plt.show()
它实际上编码与PIL绘制的图像完全相同的信息量,因此机器学习学习算法例如仍然能够区分高度差异,即使我们人类不能非常清楚地看到差异。
import cv2 #通过cv2显示 cv2.imshow("im",im) cv2.waitKey() cv2.destroyAllWindows()
完整代码——Complete Code
为方便起见,我将上面的所有代码放在一个函数中,它将鸟瞰视图作为一个numpy数组返回。然后,您可以选择使用您喜欢的任何方法对其进行可视化,或者将numpy数组插入到机器学习算法中。
import numpy as np # ==============================================================================# SCALE_TO_255# ==============================================================================def scale_to_255(a, min, max, dtype=np.uint8): """ Scales an array of values from specified min, max range to 0-255 Optionally specify the data type of the output (default is uint8) """ return (((a - min) / float(max - min)) * 255).astype(dtype) # ==============================================================================# POINT_CLOUD_2_BIRDSEYE# ==============================================================================def point_cloud_2_birdseye(points, res=0.1, side_range=(-10., 10.), # left-most to right-most fwd_range = (-10., 10.), # back-most to forward-most height_range=(-2., 2.), # bottom-most to upper-most ): """ Creates an 2D birds eye view representation of the point cloud data. Args: points: (numpy array) N rows of points data Each point should be specified by at least 3 elements x,y,z res: (float) Desired resolution in metres to use. Each output pixel will represent an square region res x res in size. side_range: (tuple of two floats) (-left, right) in metres left and right limits of rectangle to look at. fwd_range: (tuple of two floats) (-behind, front) in metres back and front limits of rectangle to look at. height_range: (tuple of two floats) (min, max) heights (in metres) relative to the origin. All height values will be clipped to this min and max value, such that anything below min will be truncated to min, and the same for values above max. Returns: 2D numpy array representing an image of the birds eye view. """ # EXTRACT THE POINTS FOR EACH AXIS x_points = points[:, 0] y_points = points[:, 1] z_points = points[:, 2] # FILTER - To return only indices of points within desired cube # Three filters for: Front-to-back, side-to-side, and height ranges # Note left side is positive y axis in LIDAR coordinates f_filt = np.logical_and((x_points > fwd_range[0]), (x_points < fwd_range[1])) s_filt = np.logical_and((y_points > -side_range[1]), (y_points < -side_range[0])) filter = np.logical_and(f_filt, s_filt) indices = np.argwhere(filter).flatten() # KEEPERS x_points = x_points[indices] y_points = y_points[indices] z_points = z_points[indices] # CONVERT TO PIXEL POSITION VALUES - Based on resolution x_img = (-y_points / res).astype(np.int32) # x axis is -y in LIDAR y_img = (-x_points / res).astype(np.int32) # y axis is -x in LIDAR # SHIFT PIXELS TO HAVE MINIMUM BE (0,0) # floor & ceil used to prevent anything being rounded to below 0 after shift x_img -= int(np.floor(side_range[0] / res)) y_img += int(np.ceil(fwd_range[1] / res)) # CLIP HEIGHT VALUES - to between min and max heights pixel_values = np.clip(a=z_points, a_min=height_range[0], a_max=height_range[1]) # RESCALE THE HEIGHT VALUES - to be between the range 0-255 pixel_values = scale_to_255(pixel_values, min=height_range[0], max=height_range[1]) # INITIALIZE EMPTY ARRAY - of the dimensions we want x_max = 1 + int((side_range[1] - side_range[0]) / res) y_max = 1 + int((fwd_range[1] - fwd_range[0]) / res) im = np.zeros([y_max, x_max], dtype=np.uint8) # FILL PIXEL VALUES IN IMAGE ARRAY im[y_img, x_img] = pixel_values return im
责任编辑:lq
-
Birdseye:极其强大的Python调试工具2023-10-21 1201
-
点云数据详解——点云数据变为图像2023-03-27 4693
-
Python调试工具-Birdseye2023-02-24 1916
-
如何在HMI中创建诊断视图2022-10-26 2844
-
OpenHarmony之轻松创建和显示进度、数据或错误视图2022-03-24 537
-
stm32连接机智云创建2021-08-09 2151
-
在机智云上创建项目和数据集2021-08-03 2005
-
计算机视觉:三维点云数据处理学习内容总结2020-11-27 6117
-
数据库教程之视图和游标的详细资料说明2019-03-01 1272
-
数据库教程之索引和视图的详细资料概述免费下载2018-10-19 1300
-
dlp4500点云数据2018-08-29 2765
-
dlp4500 点云数据2018-06-21 5318
-
MySQL 教程—视图数据操作2017-09-11 684
全部0条评论

快来发表一下你的评论吧 !
