

RFE递归特征消除特征排序
描述
本文主要从股市数据变量的特征分布及特征重要性两个角度对数据进行分析。通过绘制图表等方法分析特征本身对分布状况或特征间相互关系。通过机器学习模型方法分析出特种重要性排序,选出对结果贡献较大对那几个特征,这对后面建模对模型效果有着不可小觑对效果。
数据准备
df.info()特征构造
df['H-L'] = df['High'] - df['Low'] df['O-C'] = df['Adj Close'] - df['Open'] df['3day MA'] = df['Adj Close'].shift(1).rolling(window=3).mean() df['10day MA'] = df['Adj Close'].shift(1).rolling(window=10).mean() df['30day MA'] = df['Adj Close'].shift(1).rolling(window=30).mean() df['Std_dev'] = df['Adj Close'].rolling(5).std() df.dtypes
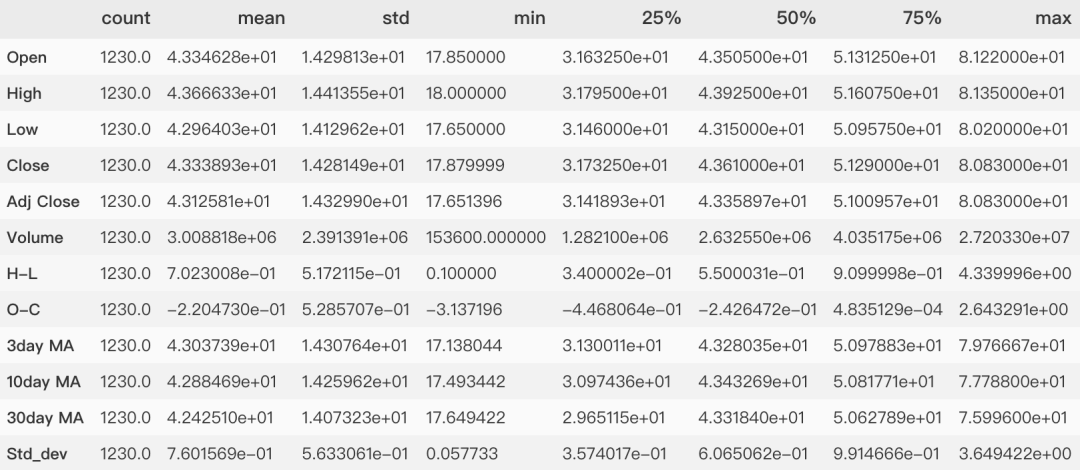
描述性统计
df.describe().T
缺失值分析
检查缺失值
df.isnull().sum()
Open 0 High 0 Low 0 Close 0 Adj Close 0 Volume 0 H-L 0 O-C 0 3day MA 3 10day MA 10 30day MA 30 Std_dev 4 dtype: int64
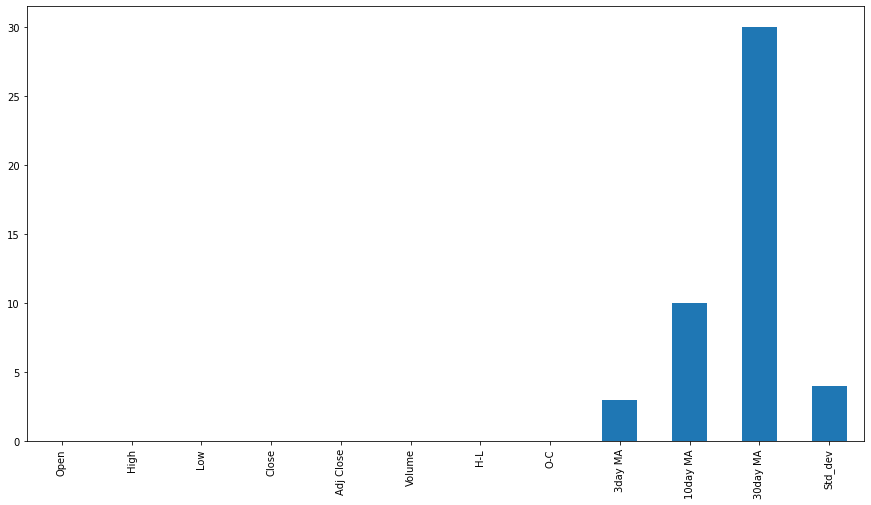
缺失值可视化
这里使用Series的属性plot直接绘制条形图。df_missing_count = df.isnull().sum() # -1表示缺失数据 # 另一个不常见的设置画布的方法 plt.rcParams['figure.figsize'] = (15,8) df_missing_count.plot.bar() plt.show()
for column in df: print("column nunique NaN") print("{0:15} {1:6d} {2:6}".format( column, df[column].nunique(), (df[column] == -1).sum()))
column nunique NaN Open 1082 0 High 1083 0 Low 1025 0 Close 1098 0 Adj Close 1173 0 Volume 1250 0 H-L 357 0 O-C 1237 2 3day MA 1240 0 10day MA 1244 0 30day MA 1230 0 Std_dev 1252 0
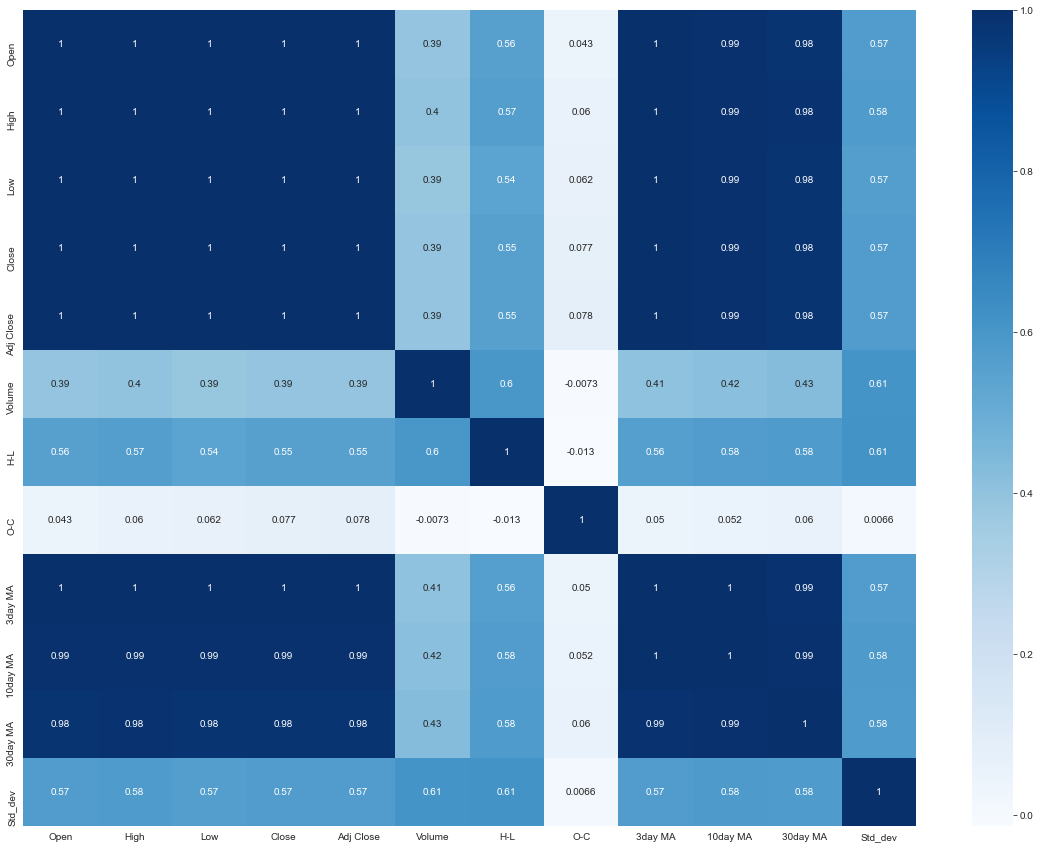
特征间相关性分析
import seaborn as sns # 一个设置色板的方法 # cmap = sns.diverging_palette(220, 10, as_cmap=True) sns.heatmap(df.iloc[:df.shape[0]].corr() ,annot = True, cmap = 'Blues')
特征值分布
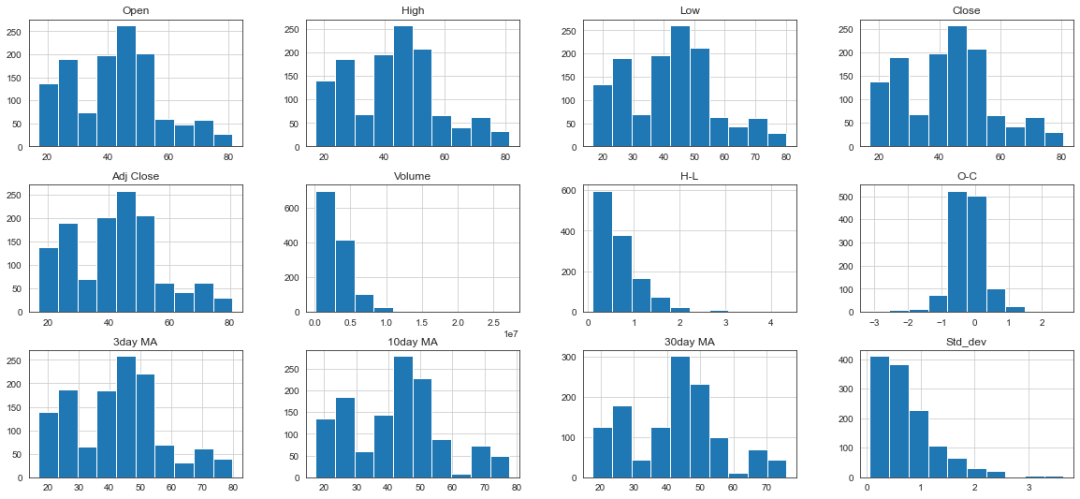
直方图
columns_multi = [x for x in list(df.columns)] df.hist(layout = (3,4), column = columns_multi) # 一种不常用的调整画布大小的方法 fig=plt.gcf() fig.set_size_inches(20,9)
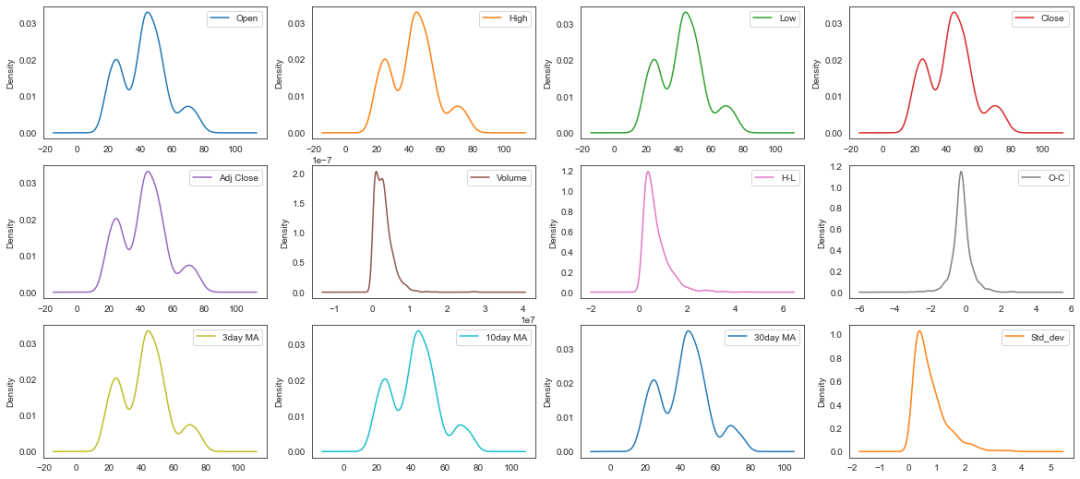
密度图
names = columns_multi df.plot(kind='density', subplots=True, layout=(3,4), sharex=False)
特征间的关系
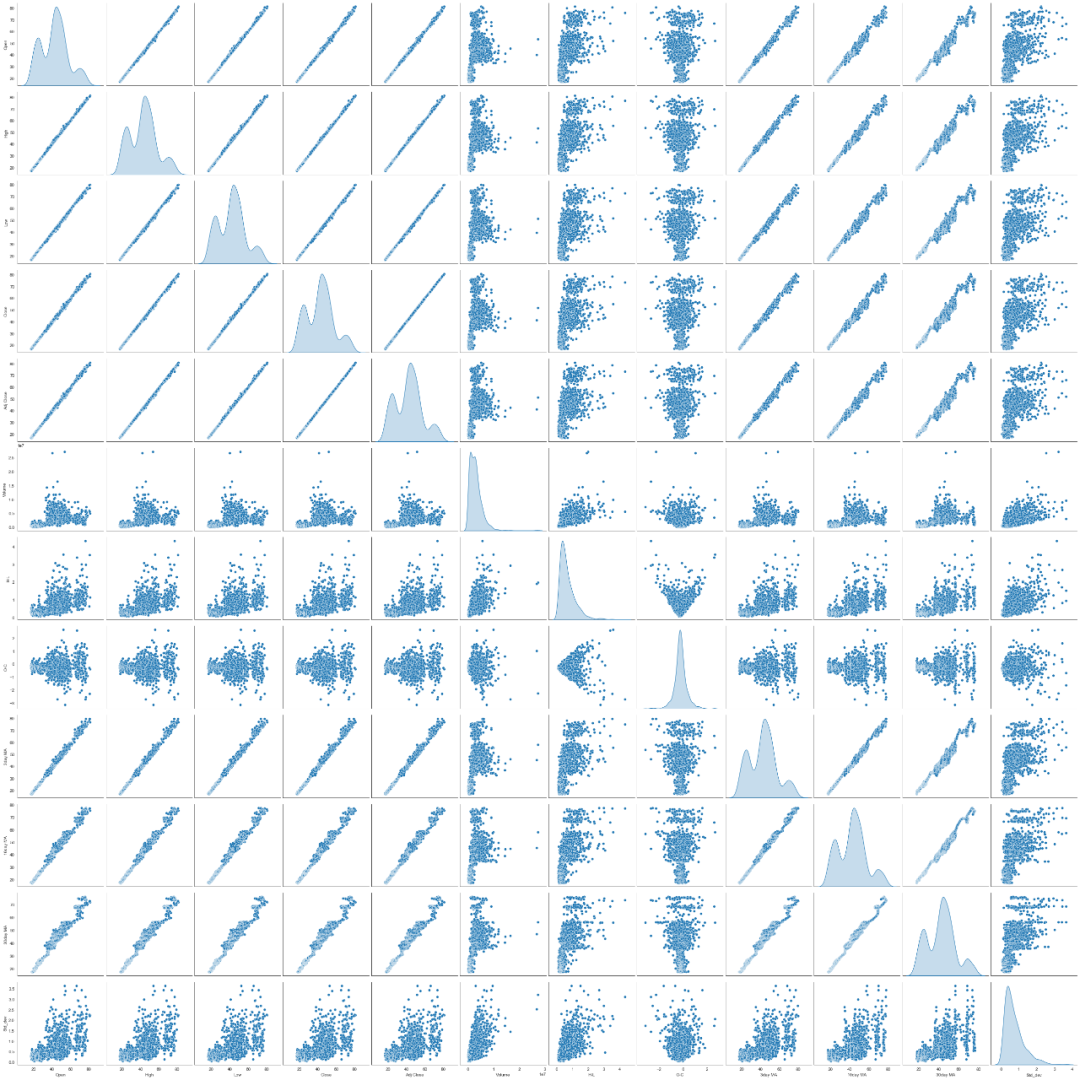
函数可视化探索数据特征间的关系sns.pairplot(df, size=3, diag_kind="kde")
特征重要性
通过多种方式对特征重要性进行评估,将每个特征的特征重要的得分取均值,最后以均值大小排序绘制特征重要性排序图,直观查看特征重要性。导入相关模块
from sklearn.feature_selection import RFE,RFECV, f_regression from sklearn.linear_model import (LinearRegression, Ridge, Lasso,LarsCV) from stability_selection import StabilitySelection, RandomizedLasso from sklearn.preprocessing import MinMaxScaler from sklearn.ensemble import RandomForestRegressor from sklearn.ensemble import RandomForestClassifier from sklearn.svm import SVR
线性回归系数大小排序
回归系数(regression coefficient)在回归方程中表示自变量 对因变量 影响大小的参数。回归系数越大表示 对 影响越大。创建排序函数
df = df.dropna() Y = df['Adj Close'].values X = df.values colnames = df.columns # 定义字典来存储的排名 ranks = {} # 创建函数,它将特征排名存储到rank字典中 def ranking(ranks, names, order=1): minmax = MinMaxScaler() ranks = minmax.fit_transform( order*np.array([ranks]).T).T[0] ranks = map(lambda x: round(x,2), ranks) res = dict(zip(names, ranks)) return res
多个回归模型系数排序
# 使用线性回归 lr = LinearRegression(normalize=True) lr.fit(X,Y) ranks["LinReg"] = ranking(np.abs(lr.coef_), colnames) # 使用 Ridge ridge = Ridge(alpha = 7) ridge.fit(X,Y) ranks['Ridge'] = ranking(np.abs(ridge.coef_), colnames) # 使用 Lasso lasso = Lasso(alpha=.05) lasso.fit(X, Y) ranks["Lasso"] = ranking(np.abs(lasso.coef_), colnames)
随机森林特征重要性排序
随机森林得到的特征重要性的原理是我们平时用的较频繁的一种方法,无论是对分类型任务还是连续型任务,都有较好对效果。在随机森林中某个特征X的重要性的计算方法如下:- 对于随机森林中的每一颗决策树, 使用相应的OOB(袋外数据)数据来计算它的袋外数据误差 ,记为.
- 随机地对袋外数据OOB所有样本的特征X加入噪声干扰 (就可以随机的改变样本在特征X处的值), 再次计算它的袋外数据误差 ,记为.
- 假设随机森林中有 棵树,那么对于特征X的重要性,之所以可以用这个表达式来作为相应特征的重要性的度量值是因为:若给某个特征随机加入噪声之后,袋外的准确率大幅度降低,则说明这个特征对于样本的分类结果影响很大,也就是说它的重要程度比较高。
连续型特征重要性
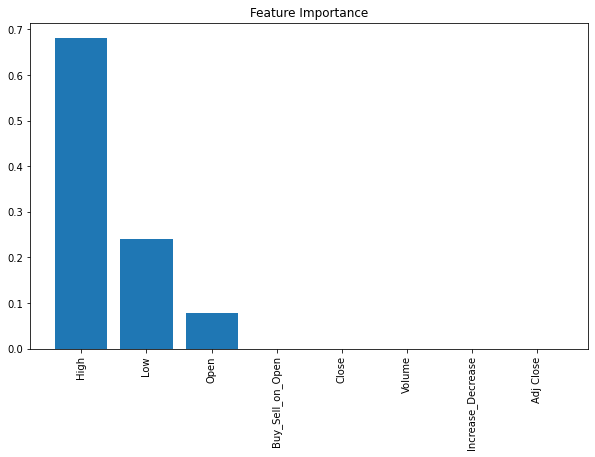
对于连续型任务的特征重要性,可以使用回归模型RandomForestRegressor中feature_importances_属性。X_1 = dataset[['Open', 'High', 'Low', 'Volume', 'Increase_Decrease','Buy_Sell_on_Open', 'Buy_Sell', 'Returns']] y_1 = dataset['Adj Close'] # 创建决策树分类器对象 clf = RandomForestRegressor(random_state=0, n_jobs=-1) # 训练模型 model = clf.fit(X_1, y_1) # 计算特征重要性 importances = model.feature_importances_ # 按降序排序特性的重要性 indices = np.argsort(importances)[::-1] # 重新排列特性名称,使它们与已排序的特性重要性相匹配 names = [dataset.columns[i] for i in indices] # 创建画布 plt.figure(figsize=(10,6)) # 添加标题 plt.title("Feature Importance") # 添加柱状图 plt.bar(range(X.shape[1]), importances[indices]) # 为x轴添加特征名 plt.xticks(range(X.shape[1]), names, rotation=90)
分类型特征重要性
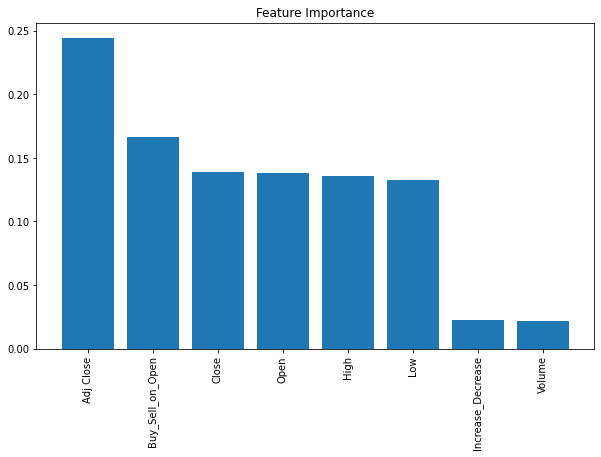
当该任务是分类型,需要用分类型模型时,可以使用RandomForestClassifier中的feature_importances_属性。X2 = dataset[['Open', 'High', 'Low','Adj Close', 'Volume', 'Buy_Sell_on_Open', 'Buy_Sell', 'Returns']] y2 = dataset['Increase_Decrease'] clf = RandomForestClassifier(random_state=0, n_jobs=-1) model = clf.fit(X2, y2) importances = model.feature_importances_ indices = np.argsort(importances)[::-1] names = [dataset.columns[i] for i in indices] plt.figure(figsize=(10,6)) plt.title("Feature Importance") plt.bar(range(X2.shape[1]), importances[indices]) plt.xticks(range(X2.shape[1]), names, rotation=90) plt.show()
本案例中使用回归模型
rf = RandomForestRegressor(n_jobs=-1, n_estimators=50, verbose=3) rf.fit(X,Y) ranks["RF"] = ranking(rf.feature_importances_, colnames); 下面介绍两个顶层特征选择算法,之所以叫做顶层,是因为他们都是建立在基于模型的特征选择方法基础之上的,例如回归和SVM,在不同的子集上建立模型,然后汇总最终确定特征得分。
RandomizedLasso
RandomizedLasso的选择稳定性方法排序。 稳定性选择是一种基于二次抽样和选择算法相结合较新的方法,选择算法可以是回归、SVM或其他类似的方法。它的主要思想是在不同的数据子集和特征子集上运行特征选择算法,不断的重复,最终汇总特征选择结果,比如可以统计某个特征被认为是重要特征的频率(被选为重要特征的次数除以它所在的子集被测试的次数)。 理想情况下,重要特征的得分会接近100%。稍微弱一点的特征得分会是非0的数,而最无用的特征得分将会接近于0。lambda_grid = np.linspace(0.001, 0.5, num=100) rlasso = RandomizedLasso(alpha=0.04) selector = StabilitySelection(base_estimator=rlasso, lambda_name='alpha', lambda_grid=lambda_grid, threshold=0.9, verbose=1) selector.fit(X, Y) # 运行随机Lasso的选择稳定性方法 ranks["rlasso/Stability"] = ranking(np.abs(selector.stability_scores_.max(axis=1)), colnames) print('finished')
{'Open': 1.0, 'High': 1.0, 'Low': 0.76, 'Close': 1.0, 'Adj Close': 0.99, 'Volume': 0.0, 'H-L': 0.0, 'O-C': 1.0, '3day MA': 1.0, '10day MA': 0.27, '30day MA': 0.75, 'Std_dev': 0.0} finished
稳定性得分可视化
fig, ax = plot_stability_path(selector) fig.set_size_inches(15,6) fig.show()
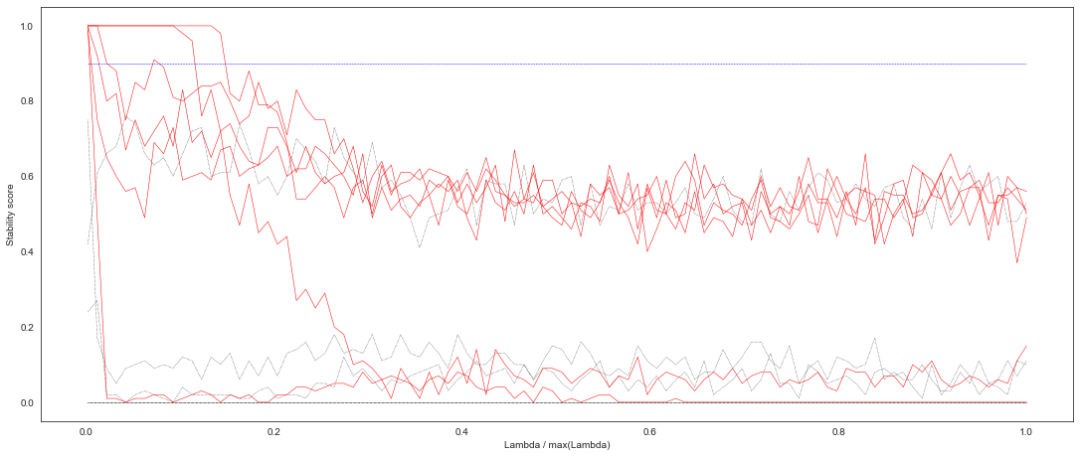
查看得分超过阈值的变量索引及其得分
# 获取所选特征的掩码或整数索引 selected_variables = selector.get_support(indices=True) selected_scores = selector.stability_scores_.max(axis=1) print('Selected variables are:') print('-----------------------') for idx, (variable, score) in enumerate( zip(selected_variables, selected_scores[selected_variables])): print('Variable %d: [%d], score %.3f' % (idx + 1, variable, score))
Selected variables are: ----------------------- Variable 1: [0], score 1.000 Variable 2: [1], score 1.000 Variable 3: [3], score 1.000 Variable 4: [4], score 0.990 Variable 5: [7], score 1.000 Variable 6: [8], score 1.000
RFE递归特征消除特征排序
基于递归特征消除的特征排序。 给定一个给特征赋权的外部评估器(如线性模型的系数),递归特征消除(RFE)的目标是通过递归地考虑越来越小的特征集来选择特征。 主要思想是反复的构建模型(如SVM或者回归模型)然后选出最好的(或者最差的)的特征(可以根据系数来选)。- 首先,在初始特征集上训练评估器,并通过任何特定属性或可调用属性来获得每个特征的重要性。
- 然后,从当前的特征集合中剔除最不重要的特征。
- 这个过程在训练集上递归地重复,直到最终达到需要选择的特征数。
sklearn.feature_selection.RFE(estimator, *, n_features_to_select=None, step=1, verbose=0, importance_getter='auto')
estimator Estimator instance 一种带有""拟合""方法的监督学评估器,它提供关于特征重要性的信息(例如"coef_"、"feature_importances_")。n_features_to_select int or float, default=None 要选择的功能的数量。如果'None',则选择一半的特性。如果为整数,则该参数为要选择的特征的绝对数量。如果浮点数在0和1之间,则表示要选择的特征的分数。step int or float, default=1 如果大于或等于1,那么'step'对应于每次迭代要删除的(整数)特征数。如果在(0.0,1.0)范围内,则'step'对应于每次迭代中要删除的特性的百分比(向下舍入)。verbose int, default=0 控制输出的冗长。importance_getter str or callable, default='auto' 如果是'auto',则通过估计器的'coef_'或'feature_importances_'属性使用特征重要性。
lr = LinearRegression(normalize=True) lr.fit(X,Y) # 当且仅当剩下最后一个特性时停止搜索 rfe = RFE(lr, n_features_to_select=1, verbose =3) rfe.fit(X,Y) ranks["RFE"] = ranking(list(map(float, rfe.ranking_)), colnames, order=-1)
Fitting estimator with 12 features. ... Fitting estimator with 2 features.
RFECV
递归特征消除交叉验证。 Sklearn提供了RFE 包,可以用于特征消除,还提供了 RFECV ,可以通过交叉验证来对的特征进行排序。# 实例化估计器和特征选择器 svr_mod = SVR(kernel="linear") rfecv = RFECV(svr_mod, cv=5) # 训练模型 rfecv.fit(X, Y) ranks["RFECV"] = ranking(list(map(float, rfecv.ranking_)), colnames, order=-1) # Print support and ranking print(rfecv.support_) print(rfecv.ranking_) print(X.columns)
LarsCV
最小角度回归模型(Least Angle Regression)交叉验证。# 删除第二步中不重要的特征 # X = X.drop('sex', axis=1) # 实例化 larscv = LarsCV(cv=5, normalize=False) # 训练模型 larscv.fit(X, Y) ranks["LarsCV"] = ranking(list(map(float, larscv.ranking_)), colnames, order=-1) # 输出r方和估计alpha值 print(larscv.score(X, Y)) print(larscv.alpha_) 以上是两个交叉验证,在对特征重要性要求高时可以使用。因运行时间有点长,这里大家可以自行运行得到结果。
创建特征排序矩阵
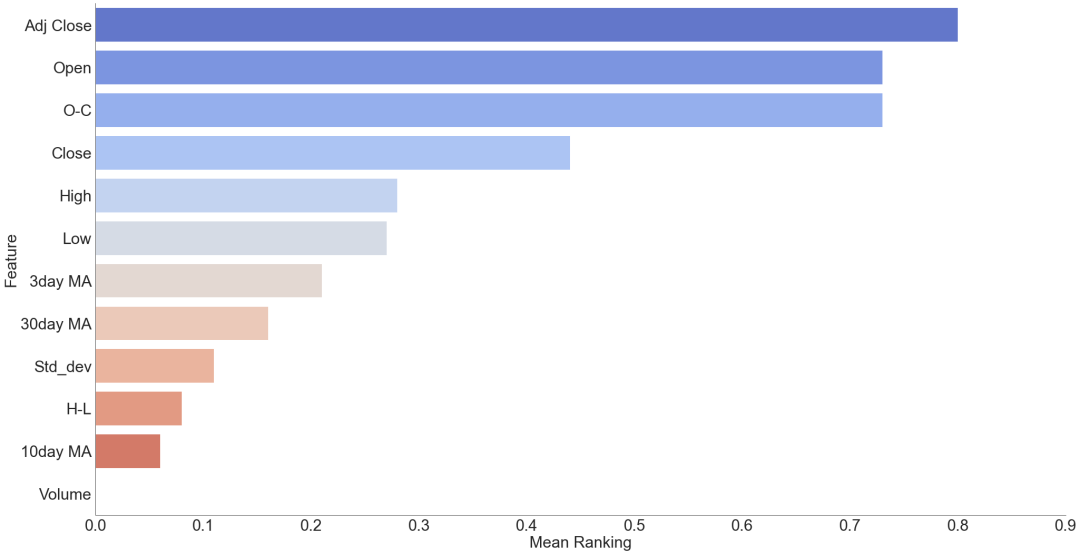
创建一个空字典来存储所有分数,并求其平均值。r = {} for name in colnames: r[name] = round(np.mean([ranks[method][name] for method in ranks.keys()]), 2) methods = sorted(ranks.keys()) ranks["Mean"] = r methods.append("Mean") print(" %s" % " ".join(methods)) for name in colnames: print("%s %s" % (name, " ".join(map(str, [ranks[method][name] for method in methods]))))
LassoLinRegRFRFERidgerlasso/StabilityMean Open1.01.00.020.910.471.00.73 High0.140.00.10.360.061.00.28 Low0.020.00.080.730.050.760.27 Close0.140.00.640.550.321.00.44 Adj Close0.021.01.00.821.00.990.8 Volume0.00.00.00.00.00.00.0 H-L0.00.00.00.450.010.00.08 O-C0.851.00.01.00.531.00.73 3day MA0.00.00.00.270.011.00.21 10day MA0.00.00.020.090.00.270.06 30day MA0.00.00.00.180.00.750.16 Std_dev0.00.00.00.640.010.00.11
绘制特征重要性排序图
将平均得到创建DataFrame数据框,从高到低排序,并利用可视化方法将结果展示出。这样就一目了然,每个特征重要性大小。meanplot = pd.DataFrame(list(r.items()), columns= ['Feature','Mean Ranking']) # 排序 meanplot = meanplot.sort_values('Mean Ranking', ascending=False) g=sns.factorplot(x="Mean Ranking", y="Feature", data = meanplot, kind="bar", size=14, aspect=1.9, palette='coolwarm')
原文标题:YYDS!使用 Python 全面分析股票数据特征
文章出处:【微信公众号:Linux爱好者】欢迎添加关注!文章转载请注明出处。
审核编辑:彭菁
声明:本文内容及配图由入驻作者撰写或者入驻合作网站授权转载。文章观点仅代表作者本人,不代表电子发烧友网立场。文章及其配图仅供工程师学习之用,如有内容侵权或者其他违规问题,请联系本站处理。
举报投诉
-
模拟电路故障诊断中的特征提取方法2016-12-09 5247
-
labview 将矩阵的特征值排序,再把排序后的特征值对应的特征向量组成矩阵2018-04-17 4024
-
如何提取颜色特征?2019-10-12 3289
-
纹理图像的特征是什么?2021-06-02 2160
-
基于统计特征主分量的信号调制识别2009-03-03 517
-
基于已知特征项和环境相关量的特征提取算法2009-04-18 879
-
特征频率,特征频率是什么意思2010-03-05 5399
-
克隆代码有害性预测中的特征选择模型2017-12-04 957
-
一种改进的结合前景背景特征的显著性检测算法2017-12-13 652
-
如何使用特征匹配和距离加权进行蓝牙定位算法2019-01-16 1501
-
机器学习之特征提取 VS 特征选择2020-09-14 4661
-
融合神经网瓶颈特征与MFCC特征的符合特征构造方法2021-03-17 898
-
基于自编码特征的语音声学综合特征提取2021-05-19 991
-
基于几何特征的人脸表情识别特征构造2021-06-09 1035
-
特征模型和特征-这是什么?2022-01-05 1254
全部0条评论

快来发表一下你的评论吧 !

