

Ohos-MPChart如何实现各种各样的图表
描述
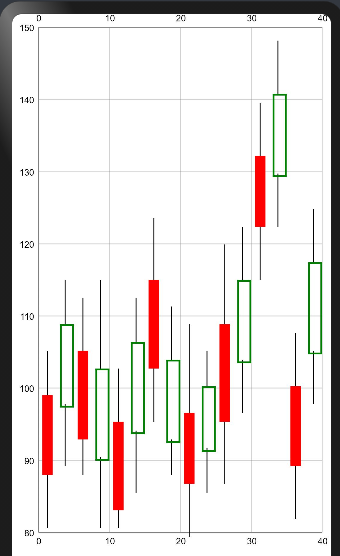
Ohos-MPChart是OpenAtom OpenHarmony(简称“OpenHarmony”)系统显示各种图表视图的三方组件,用于声明式应用开发,提供了多种多样的图表视图,包括折线图、曲线图、柱形图、饼状图、K线图、雷达图、气泡图。适用于各种统计后的数据以视觉直观的方式呈现。
使用场景
Ohos-MPChart为广大OpenHarmony应用开发者在处理数据时,使数据显示更加直观。尤其现在的大数据时代面对愈加庞大的数据只需要导入Ohos-MPChart三方组件,然后调用相关的接口就能实现各种各样的图表以方便数据汇总。
效果展示
组件功能描述
Ohos-MPChart是一个强大的图表视图,主要提供多种多样的图表视图,包括折线图、曲线图、柱形图、饼状图、K线图等等,具体功能模块如下:

开发环境
安装IDE:支持DevEco Studio 3.0 Release(Build Version 3.0.0.993)版本。 安装SDK:支持OpenHarmony API version 8 及以上版本
使用方法
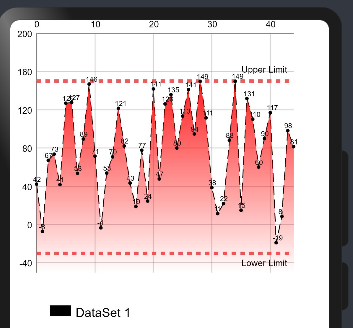
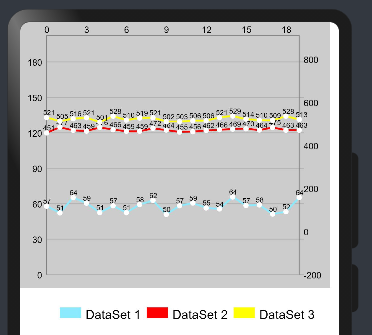
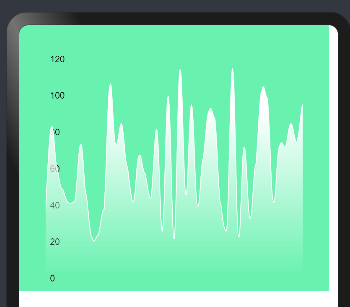
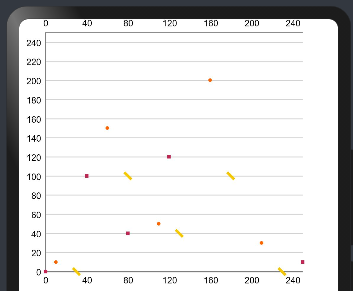
图表一:折线图
1.下载Ohos-MPChart组件并导入LineChart自定义组件:
//下载mpchart组件 npm install @ohos/mpchart --saveimport { LineChart } from '@ohos/ohos_mpchart'
OpenHarmony npm环境配置等更多内容,请参考安装教程
如何安装OpenHarmony npm包
https://gitee.com/openharmony-tpc/docs/blob/master/OpenHarmony_npm_usage.md
2.初始化数据
aboutToAppear() {    this.lineData = this.initCurveData(45, 100);    this.topAxis.setLabelCount(5, false);    this.topAxis.setPosition(XAxisPosition.TOP);    this.topAxis.setAxisMinimum(0);    this.topAxis.setAxisMaximum(50);    this.bottomAxis.setLabelCount(5, false);this.bottomAxis.setPosition(XAxisPosition.BOTTOM);    this.bottomAxis.setAxisMinimum(0);    this.bottomAxis.setAxisMaximum(50);    this.bottomAxis.setDrawAxisLine(false);    this.bottomAxis.setDrawLabels(false)
    this.leftAxis = new YAxis(AxisDependency.LEFT);    this.leftAxis.setLabelCount(7, false);    this.leftAxis.setPosition(YAxisLabelPosition.OUTSIDE_CHART);    this.leftAxis.setSpaceTop(15);    this.leftAxis.setAxisMinimum(-50);    this.leftAxis.setAxisMaximum(200);    this.leftAxis.enableGridDashedLine(5,5,0)
    this.rightAxis = new YAxis(AxisDependency.RIGHT);    this.rightAxis.setDrawGridLines(false);    this.rightAxis.setLabelCount(7, false);    this.rightAxis.setSpaceTop(11);    this.rightAxis.setAxisMinimum(-50); // this replaces setStartAtZero(true)    this.rightAxis.setAxisMaximum(200);    this.rightAxis.setDrawAxisLine(false);
    var upperLimtLine:LimitLine= new LimitLine(150, "Upper Limit");    upperLimtLine.setLineWidth(4);    upperLimtLine.enableDashedLine(10, 10, 0);    upperLimtLine.setLabelPosition(LimitLabelPosition.RIGHT_TOP);    upperLimtLine.setTextSize(10);
    var lowerLimtLine:LimitLine= new LimitLine(-30, "Lower Limit");    lowerLimtLine.setLineWidth(4);    lowerLimtLine.enableDashedLine(5, 5, 0);    lowerLimtLine.setLabelPosition(LimitLabelPosition.RIGHT_BOTTOM);    lowerLimtLine.setTextSize(10);
    this.leftAxis.setDrawLimitLinesBehindData(true);    this.leftAxis.addLimitLine(upperLimtLine);    this.leftAxis.addLimitLine(lowerLimtLine);  }  private initCurveData(count: number, range: number): LineData {
    let values = new JArrayList();
    for (let i = 0; i < 50; i++) {      let val: number = Math.random() * 180 - 30;      values.add(new EntryOhos(i, val));    }
    let gradientFillColor = new Array();    gradientFillColor.push(['#ffff0000', 0.1])    gradientFillColor.push(['#00ff0000', 1.0])
    let dataSet = new JArrayList();
    let set1 = new LineDataSet(values, "DataSet 1");    set1.setDrawFilled(true);    set1.enableDashedLine(10,5,0)    set1.setMode(Mode.LINEAR);    set1.setGradientFillColor(gradientFillColor)    set1.setColorByColor(Color.Black);    set1.setLineWidth(1)    set1.setDrawCircles(true);    set1.setCircleColor(Color.Black);    set1.setCircleRadius(2);    set1.setCircleHoleRadius(1)    set1.setCircleHoleColor(Color.Green)    set1.setDrawCircleHole(false)    dataSet.add(set1);
    return new LineData(dataSet)  }
3.添加数据到自定义曲线图表组件
build() { Stack({ alignContent: Alignment.TopStart }) { LineChart({ topAxis: this.topAxis, bottomAxis: this.bottomAxis, width: this.width, height: this.height, minOffset: this.minOffset, leftAxis: this.leftAxis, rightAxis: this.rightAxis, lineData: this.lineData, }) } }
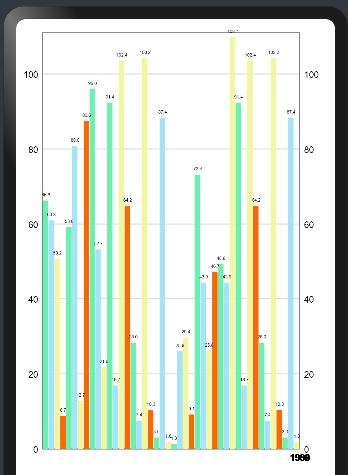
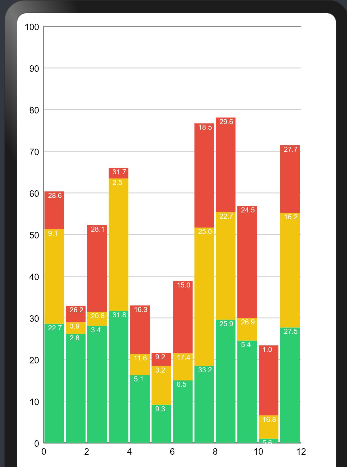
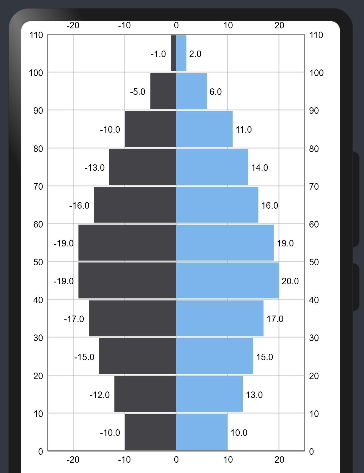
图表二:柱状图
1.导入BarChart自定义组件:
import{BarChart,BarChartModel} from '@ohos/ohos_mpchart'
2.初始化数据
@State model:BarChartModel = new BarChartModel();  width: number = 350; //表的宽度  height: number = 500; //表的高度  minOffset: number = 15; //X轴线偏移量  leftAxis: YAxis = null;  rightAxis: YAxis = null;  bottomAxis: XAxis = new XAxis();
  private aboutToAppear(){    this.leftAxis = new YAxis(AxisDependency.LEFT);    this.leftAxis.setLabelCount(6, false);    this.leftAxis.setPosition(YAxisLabelPosition.OUTSIDE_CHART);    this.leftAxis.setSpaceTop(15);    this.leftAxis.setAxisMinimum(0);    this.leftAxis.setAxisMaximum(110);    this.leftAxis.enableGridDashedLine(10,10,0)
    this.rightAxis = new YAxis(AxisDependency.RIGHT);    this.rightAxis.setDrawGridLines(false);    this.rightAxis.setLabelCount(6, false);    this.rightAxis.setSpaceTop(11);    this.rightAxis.setAxisMinimum(0);    this.rightAxis.setAxisMaximum(110);
    this.bottomAxis.setLabelCount(5, false);    this.bottomAxis.setPosition(XAxisPosition.BOTTOM);    this.bottomAxis.setAxisMinimum(0);    this.bottomAxis.setAxisMaximum(10);
    this.setData(this.bottomAxis.getAxisMaximum(),this.leftAxis.getAxisMaximum())
    this.model.width = this.width;    this.model.height = this.height;    this.model.init();    this.model.setDrawBarShadow(false);    this.model.setDrawValueAboveBar(true);    this.model.getDescription().setEnabled(false);    this.model.setMaxVisibleValueCount(60);    this.model.setLeftYAxis(this.leftAxis);    this.model.setRightYAxis(this.rightAxis);    this.model.setXAxis(this.bottomAxis)    this.model.mRenderer.initBuffers();    this.model.prepareMatrixValuePx();  }  private setData(count: number, range: number) {    let groupSpace: number = 0.08;    let barSpace: number = 0.03; // x4 DataSet    let barWidth: number = 0.2; // x4 DataSet    let groupCount: number = count + 1;    let startYear: number = 1980;    let endYear: number = startYear + groupCount;    let values1:JArrayList =     new JArrayList();    let values2:JArrayList =     new JArrayList();    let values3:JArrayList =     new JArrayList();    let values4:JArrayList =     new JArrayList();    let randomMultiplier: number = range;    for (let i = startYear; i < endYear; i++) {      values1.add(new BarEntry(i,       (Math.random() * randomMultiplier)))      values2.add(new BarEntry(i,       (Math.random() * randomMultiplier)))      values3.add(new BarEntry(i,       (Math.random() * randomMultiplier)))      values4.add(new BarEntry(i,       (Math.random() * randomMultiplier)))    }    let set1: BarDataSet,set2:     BarDataSet,set3: BarDataSet,set4: BarDataSet;    if (this.model.getBarData() != null &&    this.model.getBarData().getDataSetCount() > 0) {      set1 = this.model.getBarData().getDataSetByIndex(0) as BarDataSet;      set2 = this.model.getBarData().getDataSetByIndex(1) as BarDataSet;      set3 = this.model.getBarData().getDataSetByIndex(2) as BarDataSet;      set4 = this.model.getBarData().getDataSetByIndex(3) as BarDataSet;      set1.setValues(values1);      set2.setValues(values2);      set3.setValues(values3);      set4.setValues(values4);      this.model.getBarData().notifyDataChanged();      this.model.notifyDataSetChanged();
    } else {      let colors: number[] =       [Color.rgb(104, 241, 175),Color.rgb(164, 228, 251),Color.rgb(242, 247, 158),Color.rgb(255, 102, 0)];      set1 = new BarDataSet(values1, "Company A");      set1.setColorsByArr(colors);      set2 = new BarDataSet(values2, "Company B");      set2.setColorsByArr(colors);      set3 = new BarDataSet(values3, "Company C");      set3.setColorsByArr(colors);      set4 = new BarDataSet(values2, "Company D");      set4.setColorsByArr(colors);
      let dataSets: JArrayList =       new JArrayList();      dataSets.add(set1);      dataSets.add(set2);      dataSets.add(set3);      dataSets.add(set4);
      let data: BarData = new BarData(dataSets);      this.model.setData(data);    }    this.model.getBarData().setBarWidth(barWidth);    this.bottomAxis.setAxisMinimum(startYear);    this.bottomAxis.setAxisMaximum(startYear + this.model.getBarData().getGroupWidth(groupSpace, barSpace) * groupCount);    this.model.groupBars(startYear, groupSpace, barSpace);  }
3.添加数据到自定义曲线图表组件
build() { Stack(){ BarChart({model:this.model}) } }
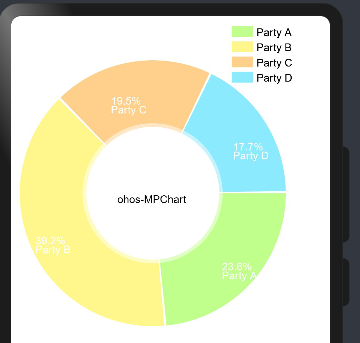
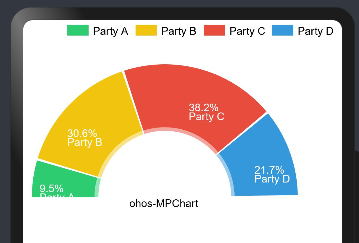
图表三:饼状图
1.导入PieChart自定义组件:
import { PieChart } from '@ohos/ohos_mpchart'
2.初始化数据
pieData: PieData = null;  @State pieModel: PieChart.Model = new PieChart.Model()  @State @Watch("seekBarXValueWatch")   seekBarX: SeekBar.Model = new SeekBar.Model()  @State @Watch("seekBarYValueWatch")   seekBarY: SeekBar.Model = new SeekBar.Model()  parties: string[] = [    "Party A", "Party B", "Party C", "Party D", "Party E", "Party F", "Party G", "Party H",    "Party I", "Party J", "Party K", "Party L", "Party M", "Party N", "Party O", "Party P",    "Party Q", "Party R", "Party S", "Party T", "Party U", "Party V", "Party W", "Party X",    "Party Y", "Party Z"]
  private aboutToAppear(): void {    this.pieData = this.initPieData(4, 10);    this.pieModel      .setPieData(this.pieData)      .setRadius(150)      .setHoleRadius(0.5)      .setOffset(new MPPointF(160,200))   // vp  }  private initPieData(count: number,   range: number): PieData{    let entries = new JArrayList();    for (var i = 0; i < count; i++) {      entries.add(new PieEntry(((Math.random() * range) + range / 5), this.parties[i % this.parties.length]))    }    //        entries.add(new PieEntry(4,'Party A'))    //        entries.add(new PieEntry(2,'Party B'))    //        entries.add(new PieEntry(5,'Party C'))    //        entries.add(new PieEntry(3,'Party D'))
    let dataSet: PieDataSet = new PieDataSet(entries,     "Election Results");    dataSet.setDrawIcons(false);    dataSet.setSliceSpace(3);    dataSet.setIconsOffset(new MPPointF(0, 40));    dataSet.setSelectionShift(5);
    // add a lot of colors    let colors: JArrayList = new JArrayList();    for (let index = 0;     index < ColorTemplate.VORDIPLOM_COLORS.length; index++) {      colors.add(ColorTemplate.VORDIPLOM_COLORS[index]);    }
    for (let index = 0;     index < ColorTemplate.JOYFUL_COLORS.length; index++) {      colors.add(ColorTemplate.JOYFUL_COLORS[index]);    }
    for (let index = 0;     index < ColorTemplate.COLORFUL_COLORS.length; index++) {      colors.add(ColorTemplate.COLORFUL_COLORS[index]);    }    for (let index = 0;     index < ColorTemplate.LIBERTY_COLORS.length; index++) {      colors.add(ColorTemplate.LIBERTY_COLORS[index]);    }    for (let index = 0;     index < ColorTemplate.PASTEL_COLORS.length; index++) {      colors.add(ColorTemplate.PASTEL_COLORS[index]);    }    colors.add(ColorTemplate.getHoloBlue());    dataSet.setColorsByList(colors);    return new PieData(dataSet)  }
3.添加数据到自定义曲线图表组件
build() { Column() { PieChart({ model: this.pieModel }) }
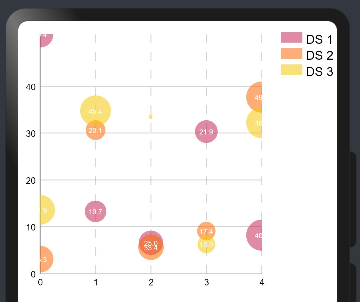
图表四:雷达图
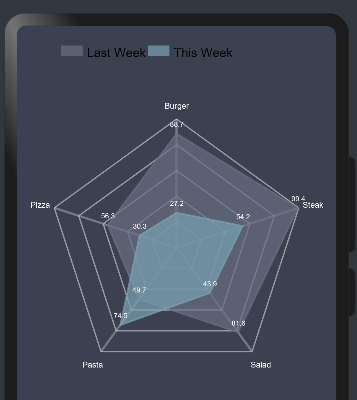
1.导入RadarChart自定义组件:
import { RadarChart } from '@ohos/ohos_mpchart';
2.初始化数据
width: number = 300; //表的宽度  height: number = 300 //表的高度  minOffset: number = 5; //X轴线偏移量  xAxis: XAxis = new XAxis(); //顶部X轴  yAxis: YAxis = new YAxis();  data:RadarData= new RadarData();  @State  radarChartMode:RadarChartMode=new RadarChartMode();public aboutToAppear() {    this.model.menuItemArr = this.menuItemArr    this.model.title = this.title
    this.data=this.initRadarData( 5,50)    this.xAxis.setTextSize(9);    this.xAxis.setYOffset(0);    this.xAxis.setXOffset(0);    this.xAxis.setTextColor(Color.White);    const mActivities:string[] = ["Burger", "Steak", "Salad", "Pasta", "Pizza"];    this.xAxis.setValueFormatter(new     class RadarAxisValueFormatter     implements IAxisValueFormatter{      public  getFormattedValue( value:number,        axisstring {        return mActivities[value % mActivities.length];      }    });    this.xAxis.longest=mActivities[0];    this.yAxis.setLabelCount(5, false);    this.yAxis.setTextSize(9);    this.yAxis.setAxisMinimum(0);    this.yAxis.setAxisMaximum(80);    this.yAxis.setDrawLabels(false);
    this.radarChartMode.mRotateEnabled=false    this.radarChartMode.setYExtraOffset(this.model.height)    this.radarChartMode.setXAxis(this.xAxis)    this.radarChartMode.setYAxis(this.yAxis)    this.radarChartMode.setWidth(this.width)    this.radarChartMode.setHeight(this.height)    this.radarChartMode.setMinOffset(this.minOffset)    this.radarChartMode.setData(this.data)    this.radarChartMode.setPaddingLeft(30)    this.radarChartMode.setPaddingTop(100)    this.radarChartMode.init();    //this.animate('Animate XY')  }
  private initRadarData(count: number,   range: number): RadarData {    let mul:number = 80;    let min:number = 20;    let cnt:number = 5;    let entries1 = new JArrayList ();    let entries2 = new JArrayList ();
    // NOTE: The order of the entries when being added to the entries array determines their position around the center of    // the chart.    for (let i = 0; i < cnt; i++) {      let val1:number = Math.random() * mul + min;      entries1.add(new RadarEntry(val1));
      let val2:number = Math.random() * mul + min;      entries2.add(new RadarEntry(val2));    }    let set1:RadarDataSet = new RadarDataSet(entries1,     "Last Week");    set1.setColorByColor(0xb4676e81);    set1.setFillColor(0xb4676e81);    set1.setDrawFilled(true);    set1.setFillAlpha(180);    set1.setLineWidth(2);    set1.setDrawHighlightCircleEnabled(true);    set1.setDrawHighlightIndicators(false);    set1.setHighlightCircleStrokeColor(0xffffffff);    set1.setHighlightCircleFillColor(0xb4676e81)    set1.setDrawValues(true)    set1.setIconsOffset(new MPPointF(0, px2vp(0)));
    let set2:RadarDataSet = new RadarDataSet(entries2, "This Week");    set2.setColorByColor(0xb479a2af);    set2.setFillColor(0xb479a2af);    set2.setDrawFilled(true);    set2.setFillAlpha(180);    set2.setLineWidth(2);    set2.setDrawHighlightCircleEnabled(true);    set2.setDrawHighlightIndicators(false);    set2.setHighlightCircleStrokeColor(0xffffffff);    set2.setHighlightCircleFillColor(0xb479a2af)    set2.setDrawValues(true)    set2.setIconsOffset(new MPPointF(0, px2vp(0)));
    let sets = new JArrayList();    sets.add(set1);    sets.add(set2);    //    let data:RadarData = new RadarData(sets);    data.setValueTextSize(8);    data.setDrawValues(this.isDrawValuesEnable);    data.setValueTextColor(Color.White);    return data  }  public getFormattedValue(value: number): string {    var str = String(value.toFixed(1)).split(".");    if(str[1] == "0"){      return str[0];    }else{      return String(value.toFixed(1))    }  }
3.添加数据到自定义曲线图表组件
build() { Column() { Stack({ alignContent: Alignment.TopStart }) { RadarChart({ radarChartMode:this.radarChartMode, }) } } }
其他图表使用方式与以上图表使用方法基本一致
- 相关推荐
- 热点推荐
- 接口
- 数据
- OpenHarmony
-
XR在娱乐领域各种各样的应用2023-01-31 3479
-
Elasticsearch底层模块:如何去规划和配置各种各样的node2022-12-22 1957
-
Ohos-MPChart——支持多种图表绘制的组件2022-09-30 1915
-
Ohos-MPChart组件功能描述2022-09-23 2355
-
为什么有各种各样的的单片机?2021-10-13 1177
-
断路器锁具适用各种各样双孔,它的特性是怎样的2021-02-22 920
-
现代世界中充满了各种各样的电子传感器2020-05-05 1690
-
这些线路中传输着各种各样的控制信号2018-12-20 2122
-
Rinspeed将推出新款无人驾驶公交 车体还分离以满足各种各样的需求2018-01-04 3832
-
一个超级的A D库,,包含各种各样的封装库,种类丰富,资料齐全2017-08-01 6569
-
求各种各样的labview的控件包,越多越好。2014-03-15 56586
-
Proteus实例集锦,包括电路图、仿真程序,各种各样的电路2013-05-12 105290
-
各种各样的电容该怎么选择?2012-11-21 3942
-
Proteus实例集锦(包括电路图.仿真程序,各种各样的电路2010-10-02 33394
全部0条评论

快来发表一下你的评论吧 !
