

Intel Developer Cloud Telemetry数据分析(二)
描述
Telemetry介绍
上一篇文章我们介绍了Intel Developer Cloud Telemetry的概念和功能,通过该功能的数据分析,可以更好地优化产品方案。有关Telemetry 的工作原理和集成方法,我将在这篇文章里细细解释。耐心看下去,相信您肯定可以在自己应用中开启这个功能。Telemetry收集流程
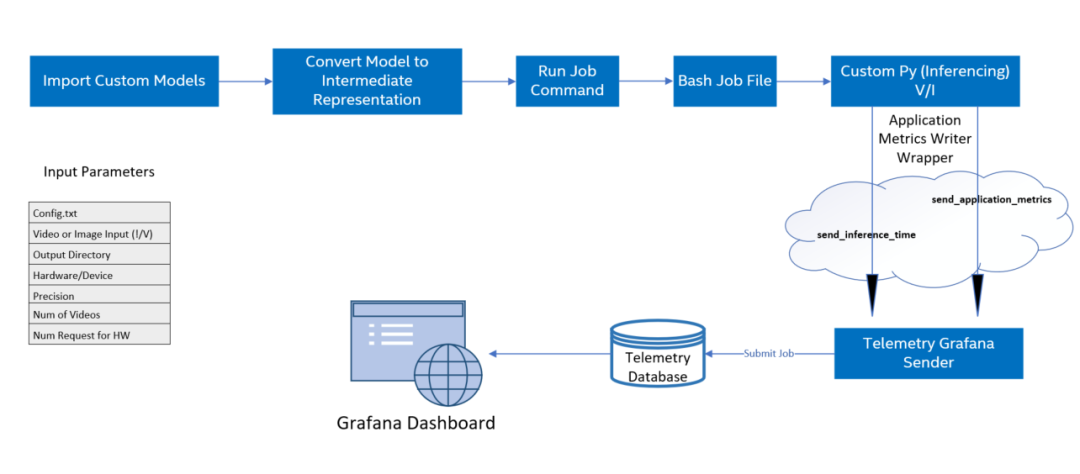 | 图 1-2 Telemetry收集数据流程 概括来说,对自定义AI模型上运行模型优化,由Intel OpenVINO进行推理,完成对AI模型的推理后,您就可以获得计算节点上可用的遥测指标。具体步骤如下: 1. 导入所有自定义模型文件(tensorflow、kaldi、onnx 等)2. 使用模型优化器以必要的精度创建模型中间表示 (IR) 文件3. 创建用于在计算节点上提交运行推理的作业文件 (.sh)4. 使用 Application Metrics Writer 启用遥测5. 为不同的计算节点提交作业并监控作业状态直到完成(提交作业会调用bash和自定义python文件)6. 在遥测仪表板上显示模型指标 注意:流程里不止包含Telemetry。而是AI应用在DevCloud上运行的流程,以便您可以了解Telemetry功能在应用里的位置。 参考:https://www.embedded.com/enabling-telemetry-for-custom-models-in-intel-devcloud-for-the-edge/
 Telemetry集成
这次依然选择object-detection-python实例来介绍集成方法,应用程序的 python 代码中调用了applicationMetricWriter模块向Telemetry传递数据指标如,帧率、推理时间、模型名称、推理硬件信息,下面通过具体代码来展示详细信息。-
Step1. 登录Jupyter Lab
-
Step2. 程序源码分析
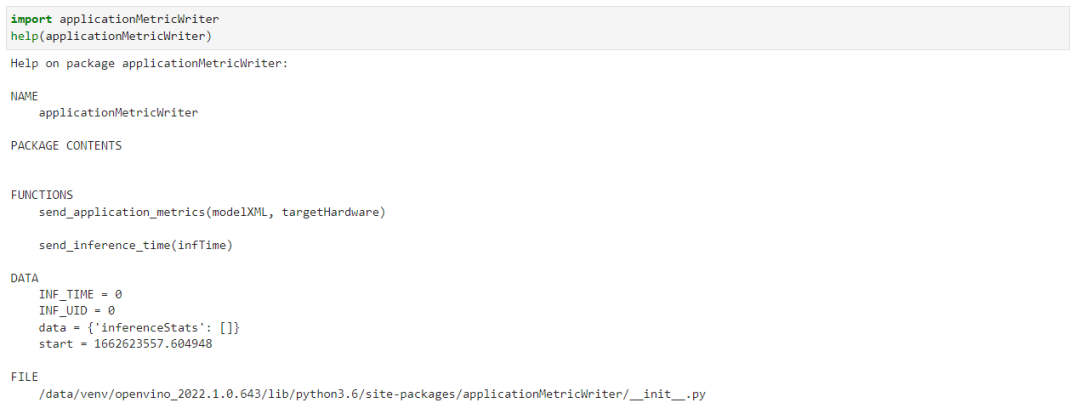 | 图 3-1 在Jupyter notebook里查看函数 可以看到它只有两个函数,使用起来非常的简单,我们来逐一介绍一下这两个函数。send_inference_time() 用来向Telemetry 数据发送每一帧推送所消耗的时间,唯一要注意的是每一帧哦。这就要求你能区分每一帧推理的时间。如果你选择async模式,就需要考虑是不是适用了。send_application_metrics 主要传递的是模型的名字和推理设备的名字,以便于你能更好地标记这个任务。 看到这你估计跟我刚开始一样,怎么没有看到上传CPU, GPU, Thermal 等数据上传呢。其实是因为这些数据都是通用的,这块就没有必要放在用户侧来每次都重复写一遍,在后端直接默认做了。从这里我们可以看到,最重要的数据还是推理时间的上传。 现在这两个函数在程序里的调用时机,这里我注释了没有必要的代码,以方便观察。
#!/usr/bin/env python
import applicationMetricWriter
...
def main():
...
try:
infer_time_start = time.time()
with open(processed_vid, "rb") as data:
while frame_count < video_len:
byte = data.read(CHUNKSIZE)
if not byte == b"":
deserialized_bytes = np.frombuffer(byte, dtype=np.uint8)
in_frame = np.reshape(deserialized_bytes, newshape=(n, c, h, w))
inf_time = time.time()
exec_net.start_async(request_id=current_inference,inputs={input_blob: in_frame})
# Retrieve the output of an earlier inference request
if previous_inference >= 0:
status = infer_requests[previous_inference].wait()
if status is not 0:
raise Exception("Infer request not completed successfully")
det_time = time.time() - inf_time
applicationMetricWriter.send_inference_time(det_time*1000)
res = output_postprocessor(exec_net.requests[previous_inference].output_blobs)
processBoxes(frame_count, res, labels_map, args.prob_threshold, width, height, result_file)
frame_count += 1
…
applicationMetricWriter.send_application_metrics(model_xml, args.device)
-
Step3. Telemetry数据访问
 | 图 3-2 Telemetry地址
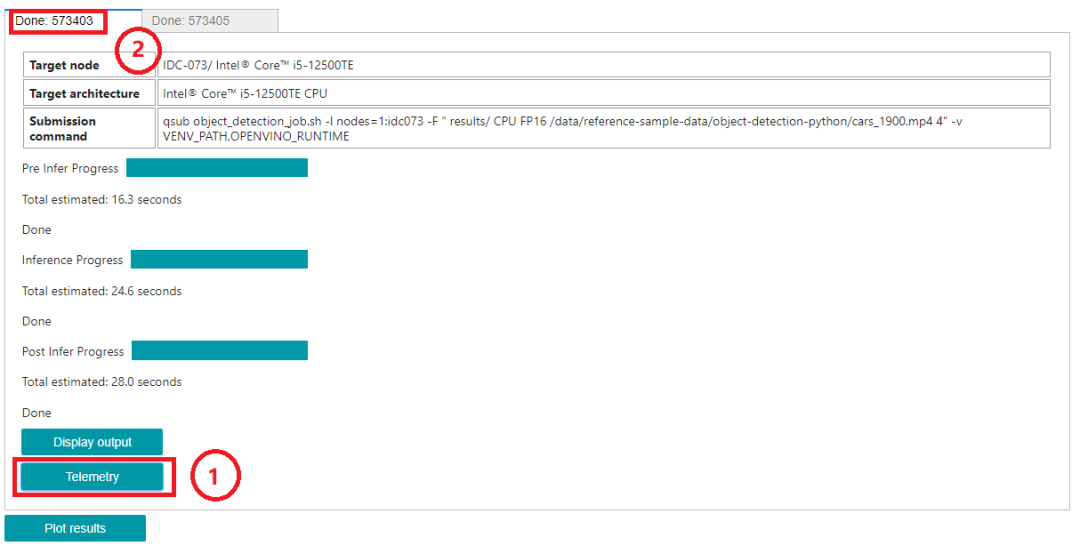
当然您也可以自己手动生成这样一个连接,注意上图中2框处的ID号。使用Telemetry 服务器地址拼接该ID号,即可访问该数据。
| 图 3-2 Telemetry地址
当然您也可以自己手动生成这样一个连接,注意上图中2框处的ID号。使用Telemetry 服务器地址拼接该ID号,即可访问该数据。https://devcloud.intel.com/edge/metrics/d/ + ID
比如:https://devcloud.intel.com/edge/metrics/d/573403 访问该路径即可获取Telemetry 的数据了。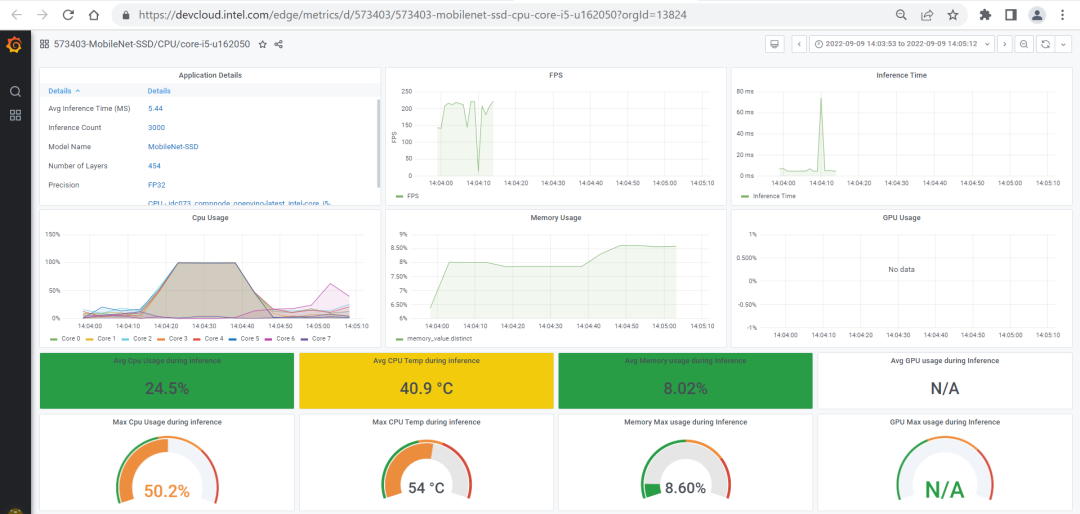 | 图 3-3 Telemetry 界面
 总 结
看到这相信您一定理解了Intel Developer Cloud Telemetry 的集成方法了,它并没有我们想象的那么复杂。我这里总结出来,只是为了方便刚开始接触这块的您更快上手,不用花费太多精力就可以更快的把事情搞定。如果您在使用过程中有碰到问题,期待一起交流。这篇就到这吧。审核编辑 :李倩
-
Intel PXA27x Processor Family Developer's Manual2009-11-23 3306
-
数据分析2012-05-28 5041
-
数据分析需要的技能2018-04-10 3265
-
怎么有效学习Python数据分析?2018-06-28 2918
-
传统的商业分析怎么被数据分析取代的2020-04-13 901
-
基于Python的数据分析2020-05-01 1845
-
BI分享秀——高度开放的数据分析经验共享2020-05-12 1667
-
BI数据分析软件使用指南2021-01-04 1806
-
成为Python数据分析师,需要掌握哪些技能2021-06-30 1544
-
电商数据分析攻略,让你轻松搞定数据分析!2023-06-27 4101
-
数据分析步骤2018-12-19 50044
-
IBM Cloud Pak for Data平台让数据分析变得更简单2022-04-14 2332
-
Intel® Developer Cloud Telemetry数据分析2023-03-17 877
-
Intel Developer Cloud Telemetry数据分析(一)2023-06-05 1248
-
Intel Developer Cloud之Telemetry数据分析2023-07-07 1175
全部0条评论

快来发表一下你的评论吧 !
