
R语言-customLayout-包拼图
电子说
1.4w人已加入
描述
目标
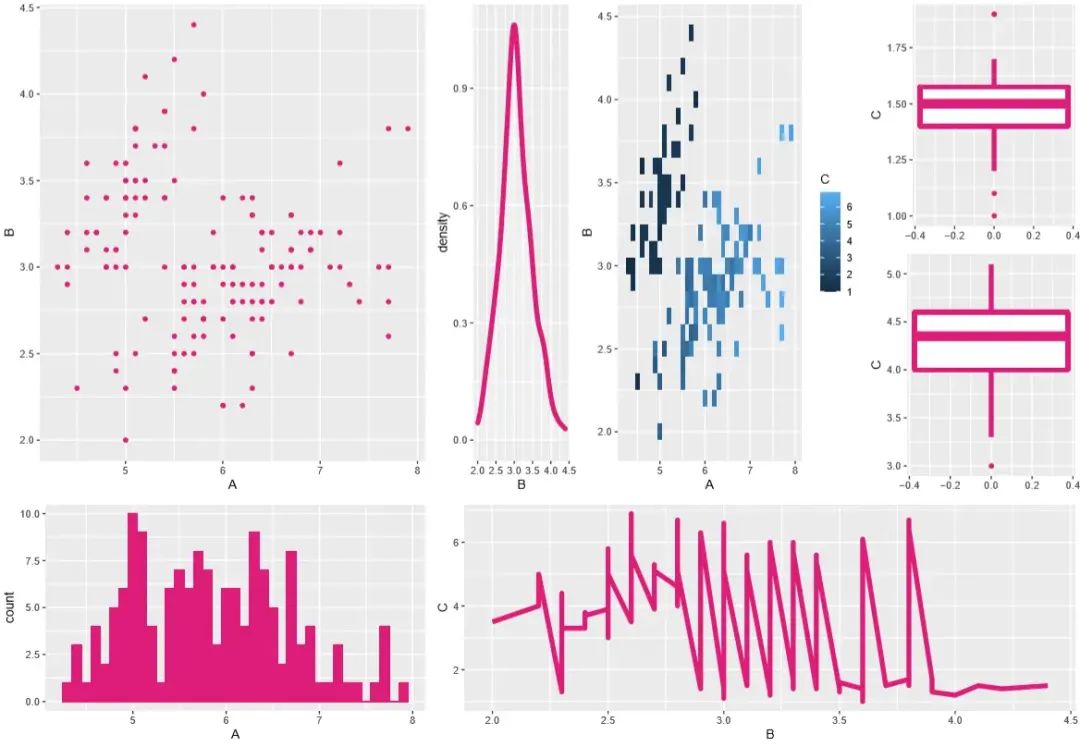
使用R拼出这样的一张图:

Let's start
1. 安装 customLayout 包
install.packages("customLayout")

# or
library(devtools)
install_github("zzawadz/customLayout")
简单介绍一下 customLayout 包:
lay_new(mat, widths, heights)- mat: 数字矩阵,以1开始且连续, 确定区数和排布顺序
- widths、heights:确定每一区的比例
lay_show(lay)- 预览分区
lay_bind_row(lay1, lay2, ..., heights)- 按行将两个布局按特定比例合并,不支持合并两个以上的布局,下同(太拉了~)
lay_bind_col(lay1, lay2, ..., widths)- 按列将两个布局按特定比例合并
lay_split_field(lay1, lay2, field = idx)- 将lay1分割一特定部分(第idx区)给lay2,即将lay2嵌入lay1的内部
lay_set(lay)- 使用指定的布局进行绘图
lay_grid(grobs, lay)- 用于绘制ggplot对象,并指定布局
- grobs: 包含多个绘图对象的list
- lay:绘图布局
有了这些功能,基本上就可以满足拼图需求了。
2. 布局设计
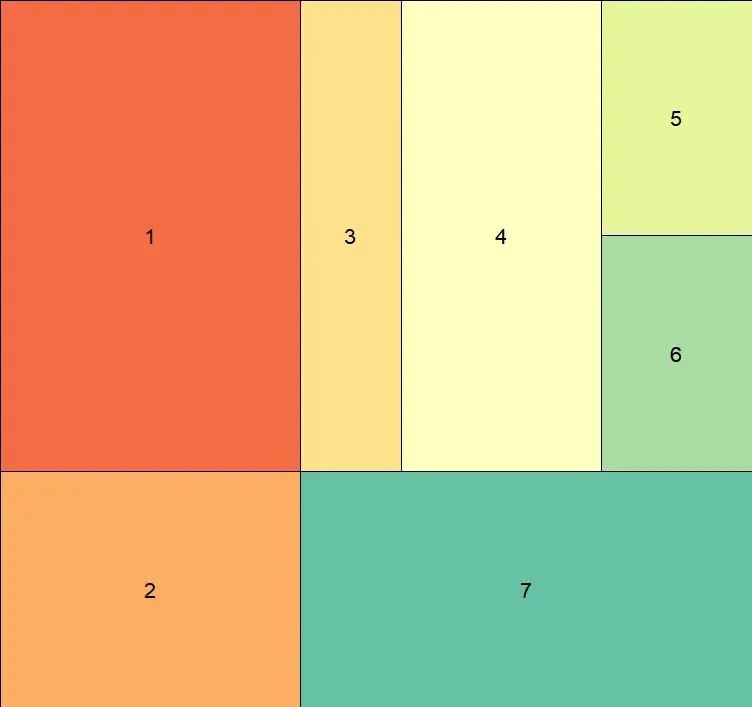
首先根据效果图将图进行分区并且编号,方便制定排版方案,编号规则为从上到下,从左到右

编号之后应该是这样的:

然后确定排版方案:
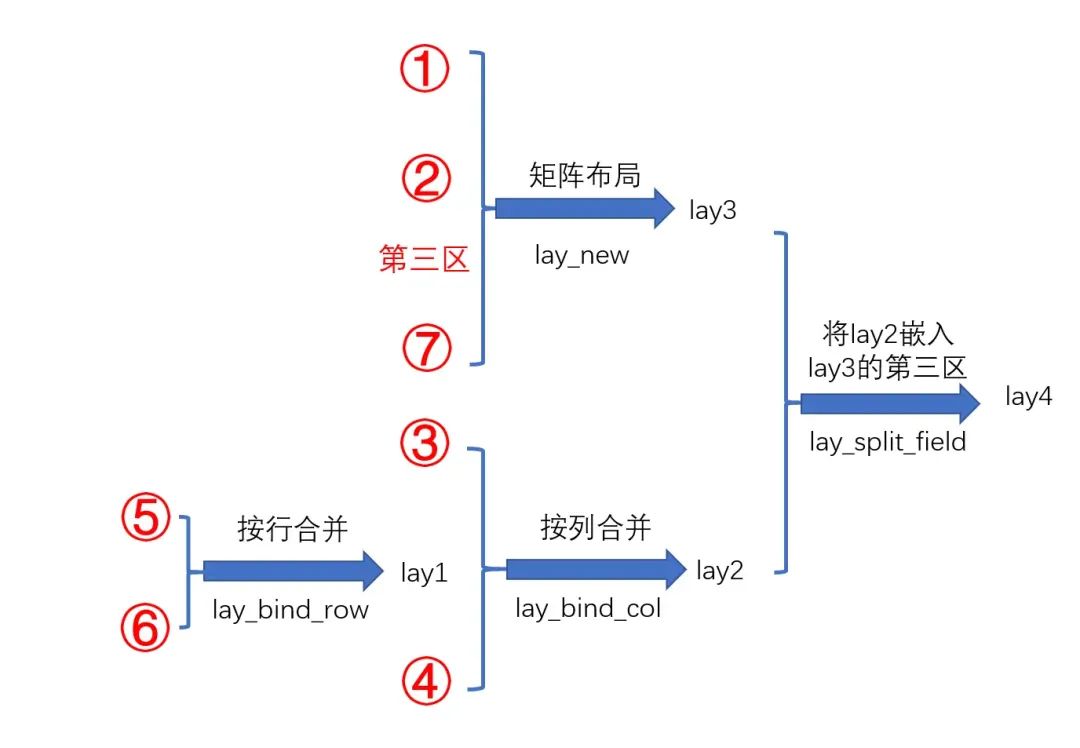
- 分为三大部分,12、3456、7 三部分
- 其中3456部分又可以分为三小部分3、4、56
- 56又可以分为5、6两小小部分 按此思路,总结为:

每大部分内部按行合并,最后将三部分按列合并,并且在排列的时候注意比例。
2. 绘制布局
Step 1:绘制 lay_3456
p3 = p4 = p5 = p6 = lay_new(matrix(1))
lay56 = lay_bind_row(p5, p6, heights = c(1, 1))
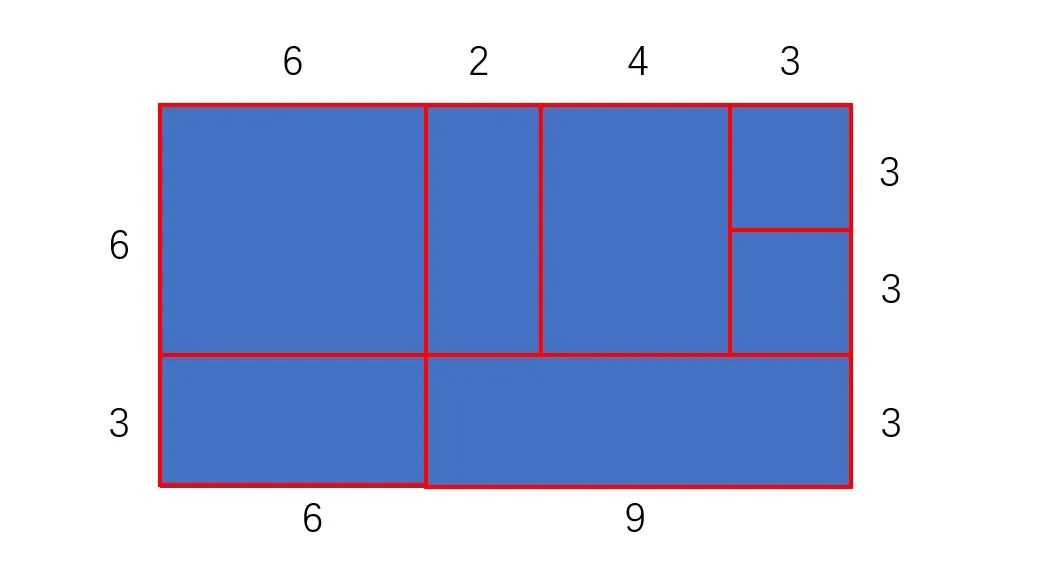
lay3456 = lay_bind_col(lay_bind_col(p3, p4, widths = c(2, 4)), lay56, widths = c(6, 3))
lay_show(lay3456)

Step 2:绘制 lay_127并与lay3456合并
lay127 = lay_new(matrix(1:4, nrow = 2), heights = c(6, 3), widths = c(6, 9))
lay_show(lay127)

lay_res = lay_split_field(lay127, lay3456, field = 3)
lay_show(lay_res)

这样布局就已经画好了,接下来直接填图就行了。
使用布局画图
先画个简单的快速看下效果:
pdf("customLayout1.pdf", 13, 9)
lay_set(lay_res)
plot(1:10)
plot(1:10)
plot(1:10)
plot(1:10)
plot(1:10)
plot(1:10)
plot(1:10)
dev.off()

再画个像样点的并测试能不能合并ggplot对象:
# test customLayout
library("customLayout")
library("ggplot2")

data = iris
colnames(data) = LETTERS[1:ncol(data)]

# plot lay3456
p3 = p4 = p5 = p6 = lay_new(matrix(1))
lay56 = lay_bind_row(p5, p6, heights = c(1, 1))
lay3456 = lay_bind_col(lay_bind_col(p3, p4, widths = c(2, 4)), lay56, widths = c(6, 3))
lay_show(lay3456)

# plot lay127 and lay_res
lay127 = lay_new(matrix(1:4, nrow = 2), heights = c(6, 3), widths = c(6, 9))
lay_show(lay127)
lay_res = lay_split_field(lay127, lay3456, field = 3)
lay_show(lay_res)

# fill lay

p1 <- ggplot(data, aes(A, B)) + geom_point(colour = "#dd1c77")
p2 <- ggplot(data, aes(A)) + geom_histogram(binwidth = 0.1, colour = "#dd1c77", fill= "#dd1c77")
p3 <- ggplot(data, aes(B)) + geom_density(alpha = 0.2, colour = "#dd1c77", fill = "white", size = 2)
p4 <- ggplot(data, aes(A, B, fill = C)) + geom_tile()
p5 <- ggplot(data[data[, "E"] == "setosa",], aes(y = C)) + geom_boxplot(colour = "#dd1c77", size = 2)
p6 <- ggplot(data[data[, "E"] == "versicolor",], aes(y = C)) + geom_boxplot(colour = "#dd1c77", size = 2)
p7 <- ggplot(data, aes(x = B, y = C)) + geom_line(colour = "#dd1c77", size = 2)

pdf("customLayout2.pdf", 13, 9)
 plots2 = lapply(c(1:7), function(x) get(paste0("p", x)))
 lay_grid(plots2, lay_res)
dev.off()

另外发现基础包的图和ggplot2的图不能合并,不过一般也不会用基础包来画图~
声明:本文内容及配图由入驻作者撰写或者入驻合作网站授权转载。文章观点仅代表作者本人,不代表电子发烧友网立场。文章及其配图仅供工程师学习之用,如有内容侵权或者其他违规问题,请联系本站处理。
举报投诉
-
HarmonyOS开发实战:【亲子拼图游戏】2024-04-16 1187
-
拼图游戏之新鸟求教老鸟2012-04-11 2427
-
键盘拼图游戏2015-04-06 2842
-
Matlab与R语言的区别2019-05-03 4319
-
用JS写一个OpenHarmony拼图小游戏2022-07-27 4042
-
拼图游戏(java)2010-04-09 555
-
微软Visual Studio支持R语言2017-10-12 833
-
r语言是什么_r语言基础教程2018-01-05 11630
-
详细介绍go语言中的闭包的实现2021-10-20 2286
-
带你了解go语言中的闭包2021-11-02 2919
-
如何用C语言实现拼图游戏项目2021-11-11 2488
-
基于STM32设计的拼图小游戏2021-11-23 1363
-
C语言+easyX带你实现:数字拼图游戏!2023-02-26 1683
-
RA78K0R Ver.1.20 语言汇编包2023-04-28 323
-
PyBadge和PyBadge LC的滑动拼图2023-07-10 457
全部0条评论

快来发表一下你的评论吧 !


