

NanoBeacon™ BLE扫描器教程(第四部分)
电子说
描述
So far, we have published three tutorials on using our new NanoBeacon™ BLE Scanner mobile app. We covered the following topics:
到目前为止,我们已经发布了三个关于使用我们新的NanoBeacon™ BLE扫描器移动应用程序的教程。我们涵盖了以下主题:
Introduction to the NanoBeacon™ BLE Scanner mobile app
NanoBeacon™ BLE扫描器移动应用程序介绍
Installation and setup
安装和设置
Overview of the different features of the app
该应用程序的不同功能概述
How to use the mobile app to discover your IN100 tags
如何使用移动应用程序来发现您的IN100标签
Overview of device filters
设备过滤器的概述
The differences between the iOS app and the Android app
iOS应用程序和Android应用程序之间的差异
App notifications for detecting triggered advertising sets
检测触发的广播集的应用程序通知
In this tutorial, we will cover the “Logs” and “Monitor” features of the mobile app (available in the latest version of the app)
在本教程中,我们将介绍移动应用程序的 "日志 "和 "监控 "功能(在应用程序的最新版本中可用)。
Let’s get started!
让我们开始吧!
Logging Feature 记录功能
First, make sure you have the latest version of the app (whether that’s for iOS or Android).
首先,确保你有最新版本的应用程序(无论是iOS还是Android)。
Once you have the latest version installed, go ahead and launch the app.
一旦你安装了最新版本,就去启动该应用程序。
For a simple test case, we’ll be configuring the IN100 with the following parameters:
对于一个简单的测试案例,我们将用以下参数配置IN100:
One advertising set
一个广播集
Advertising Data
广播数据
Advertising data format: Custom
广播数据格式:自定义
Device Name: “IN100”
设备名称:"IN100"
Manufacturer Specific Data: VCC, Internal Temp
制造商特定数据:VCC,内部温度
Advertising Parameters
广播参数
Advertising Interval: 100 ms
广播间隔:100毫秒
Once you have the parameters set as above, make sure you probe and connect to the device, then click “Run in RAM.”
一旦你设置了上述参数,确保你探测并连接到设备,然后点击 "在RAM中运行"。
Finally, import your IN100 configuration from NanoBeacon™ Config Tool (via the QR code) into the mobile app.
最后,将你的IN100配置从NanoBeacon™配置工具(通过QR码)导入移动应用程序。
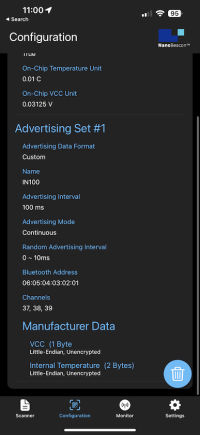
Now that we have the configuration imported into the mobile app, we should see the following in the “Configuration” view:
现在我们已经将配置导入移动应用程序,我们应该在 "配置 "视图中看到以下内容:
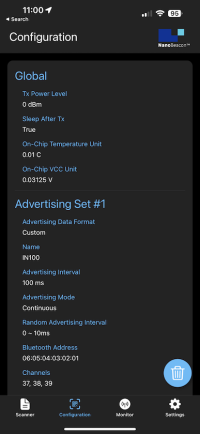
Verify that the configuration is correct, and then navigate to the “Scanner” view.
验证配置是否正确,然后导航到 "扫描器 "视图。
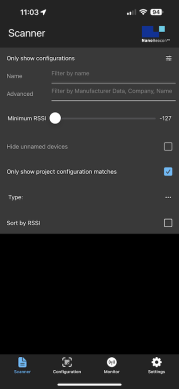
Once in the Scanner view, enable the filter “Only show project configuration matches”:
一旦进入 "扫描器 "视图,启用过滤器 "只显示项目配置匹配":
Now, exit the filter view and refresh the scan. You should see the following on screen:
现在,退出过滤器视图并刷新扫描。你应该在屏幕上看到以下内容:
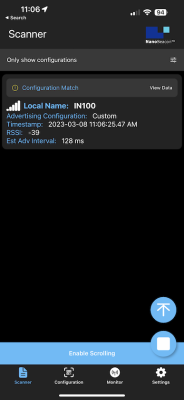
Now, click on the “View Data” text to see the detailed real-time advertising data:
现在,点击 "查看数据 "文本,查看详细的实时广播数据:
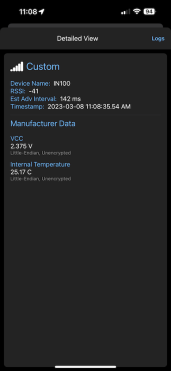
From here, notice the “Logs” button in the top right corner of the screen. Click on it, and now you should see a real-time log of the captured data. Basically, this shows the history of all the advertising data captured by the app. Once in this view, you’ll also notice that there’s an export button in the top right-hand corner of the screen:
在这里,注意屏幕右上角的 "日志 "按钮。点击它,现在你应该看到捕获数据的实时日志。基本上,这显示了该应用程序捕获的所有广播数据的历史。一旦进入这个视图,你还会注意到,在屏幕的右上角有一个导出按钮:
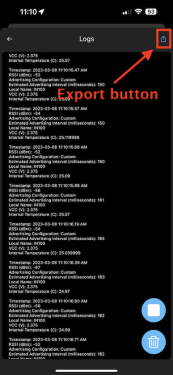
This allows you to export the full log via email, clipboard, and other methods supported by your device:
这允许你通过电子邮件、剪贴板和你的设备支持的其他方法导出完整的日志:
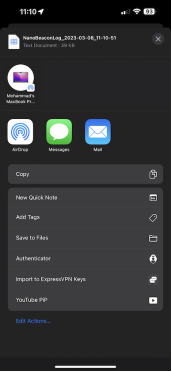
The exported format is in CSV (comma-separated values), so you can easily import it into Excel or any other spreadsheet app you choose.
导出的格式是CSV(omma-separated values),所以你可以很容易地把它导入Excel或你选择的任何其他电子表格应用程序。
You’ll also notice two other icons in the bottom right-hand corner of the screen, the trash icon(
-
松下MPS媒体制作平台 第九篇:视频混合器插件(第四部分)2025-01-16 1585
-
【北京迅为】iTOP-i.MX6开发板使用手册第四部分固件编译第十四章非设备树Android4.4系统编译2024-09-12 1923
-
硬件即代码第四部分:嵌入式RAM2023-06-14 718
-
NanoBeacon™ BLE扫描器教程(第四部分)2023-06-08 1378
-
NanoBeacon™ BLE扫描器教程2023-06-02 1445
-
NanoBeacon™ BLE扫描器教程(第二部分)2023-05-31 1862
-
NanoBeacon™ BLE扫描器教程(第一部分)2023-05-25 1886
-
NanoBeacon™ BLE扫描器移动应用程序上架应用宝2023-05-22 1184
-
什么是低压降稳压器(LDO)的压降? - 第五部分2021-03-26 1906
-
2012年PSoC数模混合设计培训_第四部分2017-10-27 783
-
【蓝牙4.1】+ 分享一本好书《Psoc 体系结构与编程》四部分完全版2015-06-11 74172
-
独特的51单片机教程第四部分—牛人经验,论坛独家奉献2011-11-21 49511
-
国内卫星通信地球站发射接收和地面通信设备技术要求 第四部分中2009-10-05 767
-
火力发电厂水汽分析方法 第四部分:氯化物的测定 (电极法)D2009-06-08 723
全部0条评论

快来发表一下你的评论吧 !
