

Linux内核HardLockUp机制解析
嵌入式技术
描述
linux内核hardlockup机制:
hardlockup 是watchdog框架下的一种关注于中断发生后一直占用CPU而其它中断无法响应导致的系统问题的一种debug方法. 具体的超时判断时间一般为10S,也可以通过sysctrl watchdog_thresh 来进行修改.
当触发hardlockup时内核会打印当前的调用堆栈信息或者配置为panic可以触发panic并打印当前堆栈信息. 可以通过sysctrl hardlockup_panic进行动态修改, 可以通过 CONFIG_BOOTPARAM_HARDLOCKUP_PANIC进行配置.
hardlockup机制实现基础:
hardlockup 实现上依赖于下面内容:
a) watchdog的内核框架
b) 高精度timer框架: 高精度timer即hrtimer的实现在不同的计算机体系结构上会有不同的硬件去实现.
c) perfEvent框架: perfEvent的实现同样不同的计算机体系结构会有不同的实现方式,他们都依赖于具体的计算机体系结构, 而ARM实现perf Event的方式我们之前有做过简单分析,具体的参考之前这篇文章.
hardlockup实现的框架图:
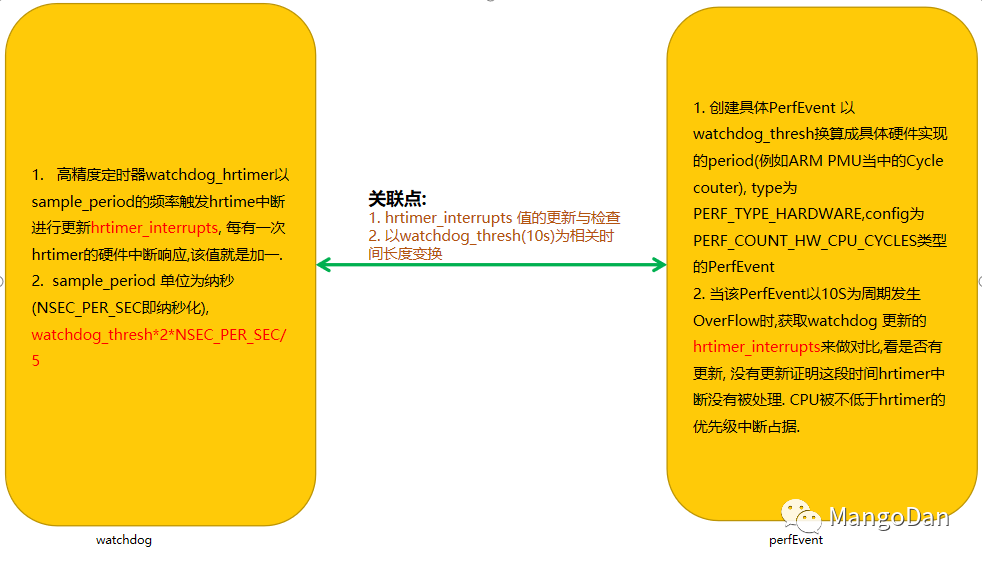
hardlockup实现机制
hardlockup工作机制的源码解读(依赖计算机体系结构实现的PerfEvent以ARM的PMU为示例进行解读):
启动watchdog hrtimer并创建PerfEvent过程如下:
//kernel/watchdog.c
void __init lockup_detector_init(void){
   ...
  if (!watchdog_nmi_probe())//创建对应perfEvent
    nmi_watchdog_available = true;
  lockup_detector_setup();//启动高精度timer的watchdog同时触发PerfEvent
}
下面我们来看看Perf Event的创建过程.
//kernel/watchdog_hld.c
int __init hardlockup_detector_perf_init(void){
  int ret = hardlockup_detector_event_create();//hardloopup 创建对应perfevent过程
  ...
}
//对应perf Event 创建额type以及config
static struct perf_event_attr wd_hw_attr = {
  .type    = PERF_TYPE_HARDWARE,
  .config    = PERF_COUNT_HW_CPU_CYCLES,
  .size    = sizeof(struct perf_event_attr),
  .pinned    = 1,
  .disabled  = 1,
};


static int hardlockup_detector_event_create(void)
{
  ...
  struct perf_event_attr *wd_attr;
  struct perf_event *evt;
  wd_attr = &wd_hw_attr;
  //这句和具体的体系结构有关系,对应的ARM的PMU为换算成对应cycle counter.
  wd_attr- >sample_period = hw_nmi_get_sample_period(watchdog_thresh);


  /* Try to register using hardware perf events */
  /* watchdog_overflow_callback为cycle counter发生overflow时触发的handler
  * 对应到我们之前讲的Perf Event基石PMU那篇文章就是 armv8pmu_handle_irq中
  * call到perf_event_overflow函数 */
  evt = perf_event_create_kernel_counter(wd_attr, cpu, NULL,
                 watchdog_overflow_callback, NULL);
   ...
  return 0;
}
关于具体创建的我们稍后再详细叙述, 这里只需要知道创建的具体过程是通过perf_event_overflow来实现的, 并且watchdog_overflow_callback是在对应PMU的counter overflow时会产生对应不可屏蔽中断(NMI).我们先看一下watchdog_overflow_callback的具体实现, 具体实现如下:
//kernel/watchdog_hld.c
/* 看到了吗? 该函数参数是可以与 armv8pmu_handle_irq中call到的
* perf_event_overflow传递的参数是一致的
* 我们稍后解析这个函数是如何给具体的PerfEvent的 */
static void watchdog_overflow_callback(struct perf_event *event,
               struct perf_sample_data *data,
               struct pt_regs *regs){
  ...
  //watchdog_nmi_touch这个为可抢占case路径提供的接口,我们不做讨论
  if (__this_cpu_read(watchdog_nmi_touch) == true) {
    __this_cpu_write(watchdog_nmi_touch, false);
    return;
  }
  //
  if (!watchdog_check_timestamp())
    return;
  /* is_hardlockup的实现就是判断hrtimer_interrupts与
  * 上次发生时保存的hrtimer_interrupts_saved是否相等,相等即hrtimer没有做过响应
  * 即触发了hardlockup机制*/
  if (is_hardlockup()) {
      ...
     /* only print hardlockups once */
    if (__this_cpu_read(hard_watchdog_warn) == true)
      return;
    //show对应信息或者dump堆栈信息.
    if (regs)
      show_regs(regs);
    else
      dump_stack();
      ...
     if (hardlockup_panic)
         nmi_panic(regs, "Hard LOCKUP");//触发对应kernel panic
     ...
  }
}
我们再来看看是如何更新hrtimer_interrupts与hrtimer_interrupts_saved的
//kernel/watchdog.c
lockup_detector_init
  -- >lockup_detector_setup
     -- >lockup_detector_reconfigure
        -- >softlockup_start_all
           -- >smp_call_on_cpu//每个CPU的核都对应绑定一个
              -- >watchdog_enable
//如果对应支持CPU的热插拔,会在cpu online中同样做触发
static void watchdog_enable(unsigned int cpu) {
  struct hrtimer *hrtimer = this_cpu_ptr(&watchdog_hrtimer);
  struct completion *done = this_cpu_ptr(&softlockup_completion);
   ...
  /*Start the timer first to prevent the NMI watchdog triggering
   * before the timer has a chance to fire.
   */
  /* watchdog_timer_fn在以间隔时间sample_period=watchdog_thresh*2*NSEC_PER_SEC/5
  * 即默认(watchdog_thresh为10S) 4S为周期的状况下做一次hrtimer的触发*/
  hrtimer_init(hrtimer, CLOCK_MONOTONIC, HRTIMER_MODE_REL);
  hrtimer- >function=watchdog_timer_fn;
  hrtimer_start(hrtimer, ns_to_ktime(sample_period),HRTIMER_MODE_REL_PINNED);
  ...
  //Enable the perf event,启动前面创建的perfEvent,如果没有创建则进行创建
  if (watchdog_enabled & NMI_WATCHDOG_ENABLED)
        watchdog_nmi_enable(cpu);
}
//watchdog kicker functions
static enum hrtimer_restart watchdog_timer_fn(struct hrtimer *hrtimer){
  ...
  /* kick the hardlockup detector */
  watchdog_interrupt_count(); //对hrtimer_interrupts进行更新.
  ...
}
以上就是我们看到的"hardlockup实现机制"的具体代码实现部分.那么我们再来剖析另一个关键点: 该PerfEvent事件的创建过程,即perf_event_create_kernel_counter的实现过程
//kernel/events/core.c
/**
 * perf_event_create_kernel_counter
 *
 * @attr: attributes of the counter to create
 * @cpu: cpu in which the counter is bound
 * @task: task to profile (NULL for percpu)
 */
struct perf_event *
perf_event_create_kernel_counter(struct perf_event_attr *attr, int cpu,
         struct task_struct *task,perf_overflow_handler_t overflow_handler,void *context){
      struct perf_event_context *ctx;
      struct perf_event *event;
      ...
      /* 创建type为PERF_TYPE_HARDWARE,config为PERF_COUNT_HW_CPU_CYCLES
      * perfiod为10s次的cycle counter*/
      event = perf_event_alloc(attr, cpu, task, NULL, NULL,overflow_handler, context, -1);
      ...
      //分配 匹配对应context。
      ctx = find_get_context(event- >pmu, task, event);
      ...
      perf_install_in_context(ctx, event, cpu);
      perf_unpin_context(ctx);
      ...
      return event;
}
/*分配并且初始化perfevent */
static struct perf_event *
perf_event_alloc(struct perf_event_attr *attr, int cpu,struct task_struct *task,
     struct perf_event *group_leader,struct perf_event *parent_event,
     perf_overflow_handler_t overflow_handler,void *context, int cgroup_fd){
     struct pmu *pmu;
     struct perf_event *event;
     struct hw_perf_event *hwc;
     ...
     //分配perf_event空间
     event = kzalloc(sizeof(*event), GFP_KERNEL);
     ...//初始化变量
     init_waitqueue_head(&event- >waitq);
     init_irq_work(&event- >pending, perf_pending_event);
     ...
     /* perf_event 做初始化,直接初始化到具体type的config
     * -- >perf_init_event
     *   -- >perf_try_init_event
     *     -- > pmu- >event_init(event)
     * /
     pmu = perf_init_event(event);
     ...
 }

 //drivers/perf/arm_pmu.c
 static int armpmu_event_init(struct perf_event *event){
     ....
     /*根据之前perfEvent基石PMU中code的分析,改map_event对应为PMU中的
     * armv8_pmuv3_perf_map 进行匹配,由于我们的config传入的是PERF_COUNT_HW_CPU_CYCLES
     * 所以对应的PMU的事件为ARMV8_PMUV3_PERFCTR_CPU_CYCLES */
    if (armpmu- >map_event(event) == -ENOENT)
       return -ENOENT;
    return __hw_perf_event_init(event);
 }
自此,PERF_COUNT_HW_CPU_CYCLES的PefEvent事件就创建成功,后面的work 流程就如同文章中Perf Event基石PMU讨论的那样。
总结:
hardlockup实际上就是一种debug cpu被中断hung主的机制,它利用的NMI(不可屏蔽中断)来定时监控hrtimer中断在监控时间段内是否有更新, 如果未更新,则证明发生异常,异常后的行为根据配置的不同会有不同的表现。
-
详解linux内核的uevent机制2024-09-29 3373
-
Linux内核中的页面分配机制2024-08-07 1249
-
一文解析Linux中ARP学习和老化机制2023-08-04 2302
-
Linux内核SoftLockUp机制解析2023-06-23 2451
-
Linux内核文件Cache机制2021-08-31 983
-
详解Linux内核抢占实现机制2019-08-06 1782
-
可以了解并学习Linux 内核的同步机制2019-05-14 1061
-
你了解过Linux内核中的Device Mapper 机制?2019-04-29 1131
-
Linux2.6 内核的 Initrd 机制解析2019-04-02 889
-
linux内核机制有哪些2017-11-14 5948
-
linux内核rcu机制详解2017-11-13 9423
-
Linux 2.4.x内核软中断机制2017-11-02 969
-
基于Linux内核2_6的进程拦截机制的研究和实现_王全民2017-03-18 1173
全部0条评论

快来发表一下你的评论吧 !
