
64核RSIC-V高性能处理器公共测试云平台 · Benchmark体系建设一期
描述
编辑:王佩
以上内容会同步更新至《64核RISC-V高性能处理器公共测试云平台·快速使用指南》中,欢迎各位开发者查阅。

Benchmark的目的是通过对所提供的基准测试,用于验证和确定目标系统的性能规模和计算能力;测试内存带宽与性能指标;测试文件系统(I/O)性能指标;测试网络带宽与性能指标;测试高性能计算机整体性能指标等。
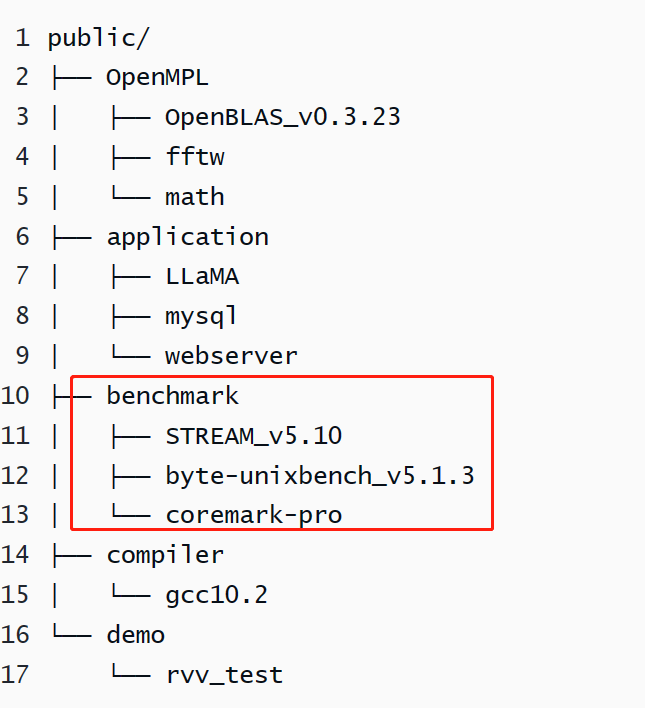
目前云平台上已经移植了三项Benchmark测试:Stream、UnixBench、CoreMark-PRO。更多测试项目和体系建设正在进行,并正在招聘实习生,欢迎参与(可加微信iYuta-R2进一步沟通了解)。本文先介绍已经完成的三项测试的结果,如果您对结果有相关什么疑问和指正,也可以通过文末的联系方式找到我们。

1. Stream
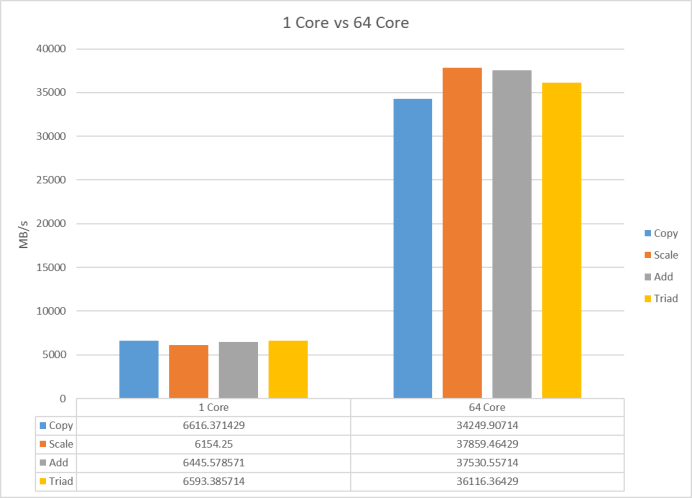
Stream 基准测试是一个简单的综合基准测试程序,用于测量可持续内存带宽(以 MB/s 为单位)以及简单向量内核的相应计算速率。测试结果如下【仅供参考】:

64 CPUs in system; running 1 parallel copy of tests


Dhrystone 2 using register variables        9401556.0 lps   (10.0 s, 7 samples)
Double-Precision Whetstone                     2875.1 MWIPS (10.0 s, 7 samples)
Execl Throughput                                719.1 lps   (30.0 s, 2 samples)
File Copy 1024 bufsize 2000 maxblocks        211569.9 KBps  (30.0 s, 2 samples)
File Copy 256 bufsize 500 maxblocks           56404.6 KBps  (30.0 s, 2 samples)
File Copy 4096 bufsize 8000 maxblocks        595552.5 KBps  (30.0 s, 2 samples)
Pipe Throughput                              306839.8 lps   (10.0 s, 7 samples)
Pipe-based Context Switching                  19074.8 lps   (10.0 s, 7 samples)
Process Creation                               1912.9 lps   (30.0 s, 2 samples)
Shell Scripts (1 concurrent)                   2549.0 lpm   (60.0 s, 2 samples)
Shell Scripts (8 concurrent)                   2104.7 lpm   (60.0 s, 2 samples)
System Call Overhead                         583954.0 lps   (10.0 s, 7 samples)


System Benchmarks Index Values               BASELINE       RESULT    INDEX
Dhrystone 2 using register variables         116700.0    9401556.0    805.6
Double-Precision Whetstone                       55.0       2875.1    522.8
Execl Throughput                                 43.0        719.1    167.2
File Copy 1024 bufsize 2000 maxblocks          3960.0     211569.9    534.3
File Copy 256 bufsize 500 maxblocks            1655.0      56404.6    340.8
File Copy 4096 bufsize 8000 maxblocks          5800.0     595552.5   1026.8
Pipe Throughput                               12440.0     306839.8    246.7
Pipe-based Context Switching                   4000.0      19074.8     47.7
Process Creation                                126.0       1912.9    151.8
Shell Scripts (1 concurrent)                     42.4       2549.0    601.2
Shell Scripts (8 concurrent)                      6.0       2104.7   3507.9
System Call Overhead                          15000.0     583954.0    389.3
                                                                   ========
System Benchmarks Index Score                                         404.7


------------------------------------------------------------------------
Benchmark Run: Tue Jul 18 2023 09:45:31 - 10:14:27
64 CPUs in system; running 64 parallel copies of tests


Dhrystone 2 using register variables      599089659.4 lps   (10.0 s, 7 samples)
Double-Precision Whetstone                   183186.6 MWIPS (10.0 s, 7 samples)
Execl Throughput                              13700.6 lps   (29.5 s, 2 samples)
File Copy 1024 bufsize 2000 maxblocks      10622116.4 KBps  (30.0 s, 2 samples)
File Copy 256 bufsize 500 maxblocks         3444789.4 KBps  (30.0 s, 2 samples)
File Copy 4096 bufsize 8000 maxblocks      10962548.9 KBps  (30.0 s, 2 samples)
Pipe Throughput                            20175106.5 lps   (10.0 s, 7 samples)
Pipe-based Context Switching                2975086.8 lps   (10.0 s, 7 samples)
Process Creation                              10684.1 lps   (30.0 s, 2 samples)
Shell Scripts (1 concurrent)                  59032.5 lpm   (60.0 s, 2 samples)
Shell Scripts (8 concurrent)                   7481.0 lpm   (60.2 s, 2 samples)
System Call Overhead                       37161452.1 lps   (10.0 s, 7 samples)


System Benchmarks Index Values               BASELINE       RESULT    INDEX
Dhrystone 2 using register variables         116700.0  599089659.4  51335.9
Double-Precision Whetstone                       55.0     183186.6  33306.7
Execl Throughput                                 43.0      13700.6   3186.2
File Copy 1024 bufsize 2000 maxblocks          3960.0   10622116.4  26823.5
File Copy 256 bufsize 500 maxblocks            1655.0    3444789.4  20814.4
File Copy 4096 bufsize 8000 maxblocks          5800.0   10962548.9  18900.9
Pipe Throughput                               12440.0   20175106.5  16217.9
Pipe-based Context Switching                   4000.0    2975086.8   7437.7
Process Creation                                126.0      10684.1    847.9
Shell Scripts (1 concurrent)                     42.4      59032.5  13922.8
Shell Scripts (8 concurrent)                      6.0       7481.0  12468.4
System Call Overhead                          15000.0   37161452.1  24774.3
                                                                   ========
System Benchmarks Index Score                                       13089.1
3. CoreMark-PROCoreMark-PRO 是一款全面、先进的处理器基准测试,可与经过市场验证的行业标准 EEMBC CoreMark 基准测试配合使用并对其进行增强。CoreMark 强调 CPU 管道,而 CoreMark-PRO 测试整个处理器,增加对多核技术、整数和浮点工作负载组合以及利用更大内存子系统的数据集的全面支持。EEMBC CoreMark 和 CoreMark-PRO 共同提供了涵盖从低端微控制器到高性能计算处理器的标准基准。EEMBC CoreMark-PRO 基准测试包含五种流行的整数工作负载和四种流行的浮点工作负载。
WORKLOAD RESULTS TABLE
MultiCore SingleCore
Workload Name (iter/s) (iter/s) Scaling
---------- ---------- ----------
384.62 85.47 4.50
core 36.32 0.59 61.56
1333.33 71.23 18.72
24.17 2.39 10.11
nnet_test 180.79 3.15 57.39
40.51 14.93 2.71
1838.24 186.53 9.85
1523.81 64.10 23.77
376.47 47.62 7.91
MARK RESULTS TABLE
Mark Name MultiCore SingleCore Scaling
---------- ---------- ----------
28467.36 2105.08 13.52
正文完
以上内容会同步更新至《64核RISC-V高性能处理器公共测试云平台·快速使用指南》中,欢迎各位开发者查阅。
快速使用指南链接:https://www.kdocs.cn/l/cmnYcyFIlVRx

欢迎关注我们,参与进来共建RISC-V软件生态~加入我们的讨论群后,可以向管理员申请免费的64核RISC-V服务器SUDO权限试用账号。
1. 加入微信讨论群:加iYuta-R2为好友后可拉入群。
2. 加入QQ讨论群:906962594(RVBoards·Only RISC-V)扫描二维码加群

原文标题:64核RSIC-V高性能处理器公共测试云平台 · Benchmark体系建设一期
文章出处:【微信公众号:澎峰科技PerfXLab】欢迎添加关注!文章转载请注明出处。
声明:本文内容及配图由入驻作者撰写或者入驻合作网站授权转载。文章观点仅代表作者本人,不代表电子发烧友网立场。文章及其配图仅供工程师学习之用,如有内容侵权或者其他违规问题,请联系本站处理。
举报投诉
-
PIC64GX1000 RISC-V MPU:一款面向嵌入式计算的高性能64位多核处理器2025-09-30 617
-
明晚开播 |开源芯片系列讲座第28期:高性能RISC-V微处理器芯片2025-07-29 1134
-
直播预约 |开源芯片系列讲座第28期:高性能RISC-V微处理器芯片2025-07-14 1075
-
第三代“香山”RISC-V 开源高性能处理器核性能进入全球第一梯队2024-04-25 2815
-
最近国产的rsic-v的mcu有什么新品发布2024-04-13 1750
-
开源芯片社区9月双周报-第一期2023-10-11 2310
-
RSIC-V与GPU的结合2023-04-14 338
-
香山是什么?“香山” 高性能开源 RISC-V 处理器项目介绍2022-04-07 6141
-
T5系列高性能四核64位智能驾驶舱处理器规格书下载2022-03-08 686
-
中科院发布国产开源高性能RISC-V处理器“香山”2021-07-01 2164
-
解析关于云计算的测试公共服务平台设计技术2021-03-23 2634
-
微处理器功耗和性能的测试方法是什么?2019-08-22 3107
-
适用于高性能运算的处理器2016-03-14 5998
-
基于ATmega64云台板卡测试平台的设计2009-06-16 875
全部0条评论

快来发表一下你的评论吧 !

