
如何用seabron生成柱状图和散点图
描述
生成柱状图
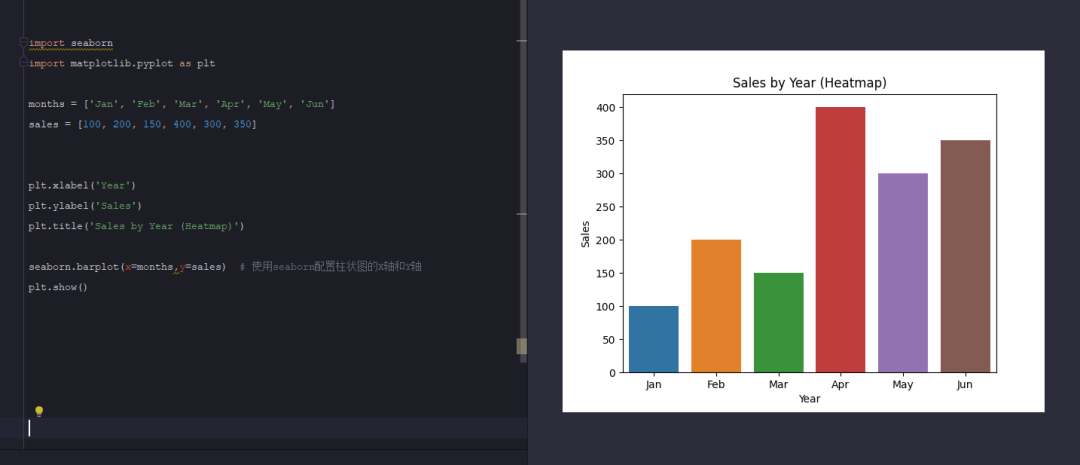
柱状图是我们经常会见到的数据图表,每个柱状都表示一组数据
import seaborn
import matplotlib.pyplot as plt

months = ['Jan', 'Feb', 'Mar', 'Apr', 'May', 'Jun']
sales = [100, 200, 150, 400, 300, 350]


plt.xlabel('Year')
plt.ylabel('Sales')
plt.title('Sales by Year (Heatmap)')

seaborn.barplot(x=months,y=sales)  # 使用seaborn配置柱状图的X轴和Y轴
plt.show()
运行代码生成柱状图

生成散点图
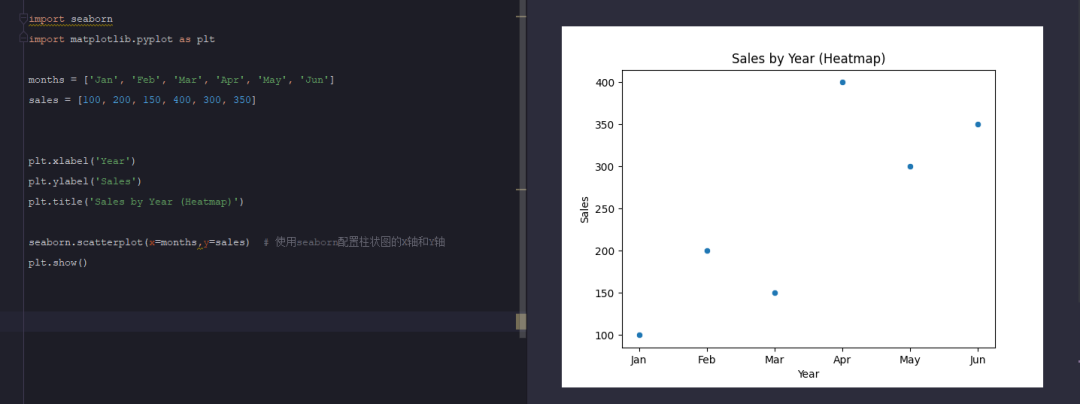
散点图顾名思义,每个表里面的一个点就代表着一组数值
import seaborn
import matplotlib.pyplot as plt

months = ['Jan', 'Feb', 'Mar', 'Apr', 'May', 'Jun']
sales = [100, 200, 150, 400, 300, 350]


plt.xlabel('Year')
plt.ylabel('Sales')
plt.title('Sales by Year (Heatmap)')

seaborn.scatterplot(x=months,y=sales)  # 使用seaborn配置散点图的X轴和Y轴
plt.show()

声明:本文内容及配图由入驻作者撰写或者入驻合作网站授权转载。文章观点仅代表作者本人,不代表电子发烧友网立场。文章及其配图仅供工程师学习之用,如有内容侵权或者其他违规问题,请联系本站处理。
举报投诉
-
基于鸿蒙原生ArkTS语法开发的图表组件--柱状图2025-03-16 857
-
labview 使用chart控件画柱状图 怎么设置X轴设置为汉字?2023-08-01 4517
-
柱状图Histogram Plot2022-06-01 460
-
请问一下怎样在MATLAB中去画一种柱状图呢2021-11-19 1822
-
Labview 柱状图2019-09-21 8784
-
Matplotlib绘制柱柱状图、直方图、条形图的使用语法2019-04-18 2086
-
Labview调用OWC11制作柱状图2019-02-22 6837
-
请问labview中使用net的chart控件如何实现柱状图?2018-06-15 8430
-
《Visual C# 2008程序设计经典案例设计与实现》---柱状图表分析图2017-05-13 2811
-
lcd12864显示柱状图2016-05-26 3059
-
Labview 2013 饼状图,柱状图,玫瑰图集合2016-03-13 32824
-
Labview怎样画柱状图和饼状图?急急急!!!!!!2015-10-31 17561
-
LabView制作柱状图,动态改变颜色,如图2014-09-22 14904
全部0条评论

快来发表一下你的评论吧 !

