

钾离子电池有机电极材料分子结构的优化策略
电池技术
描述
成果简介
由于钾元素地壳储量丰富(~2.09%)、电势较低(−2.93 V vs. SHE),钾离子电池(KIBs)有望实现与锂离子电池相当水平的能量密度与氧化还原电势;且其相比于Na+与Li+具有较低的路易斯酸度,使得K+在液态与固态电解质中的电极/电解质界面上具有更高的转移数和迁移率。得益于上述优势,钾离子电池备受关注。但由于钾离子半径较大(1.38 Å),很难找到具有大层间距和稳定骨架的主体材料来容纳大半径的K+,导致适用于KIBs的无机电极材料发展较慢。有机电极材料具有结构多样性和可调性等优点,其电化学性能依赖于K+与活性官能团之间的转化反应,不必受限于K+大半径带来的空间位阻效应。
近日,中国地质大学王圣平教授团队在EcoMat发表了题为“Improving strategies for the molecular structure of organic anode/cathode materials in potassium-ion batteries“的综述性文章,对有机KIBs的研究进展从有机正极材料、有机负极材料、电解液优化、全电池四个方面进行总结。介绍了具有各种官能团的有机材料的组成、结构、反应机理、电化学性能和开发策略。该论文可为研究人员开发高性能有机KIBs并实现有机KIBs的应用提供了指导和启示。
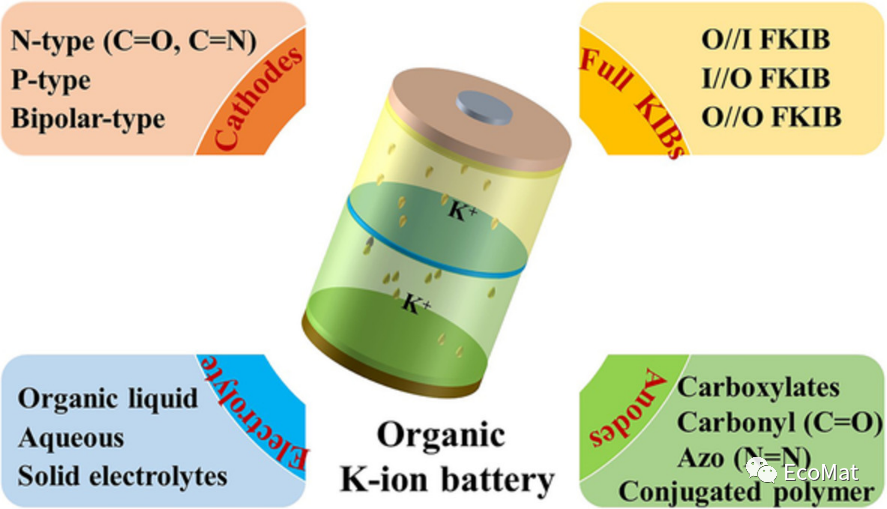
内容详情
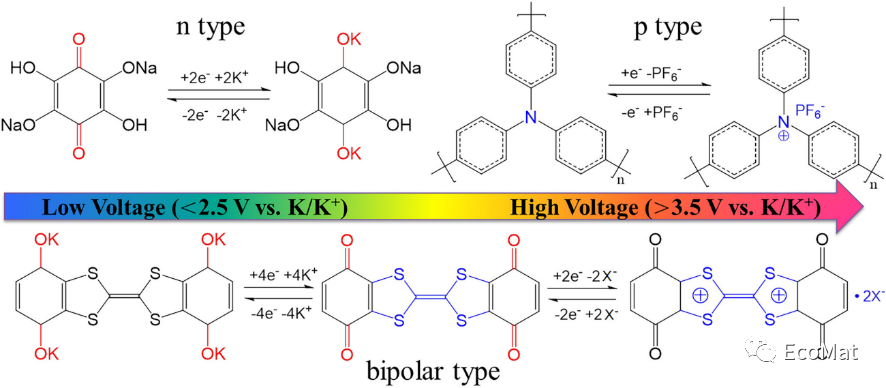
FIGURE 1 Redox mechanisms of n-type, p-type and bipolar-type organic materials. X indicates anions present in the electrolyte, such as PF6−, bis(trifluoromethanesulfonyl)imide anion (TFSI−), and FSI−.
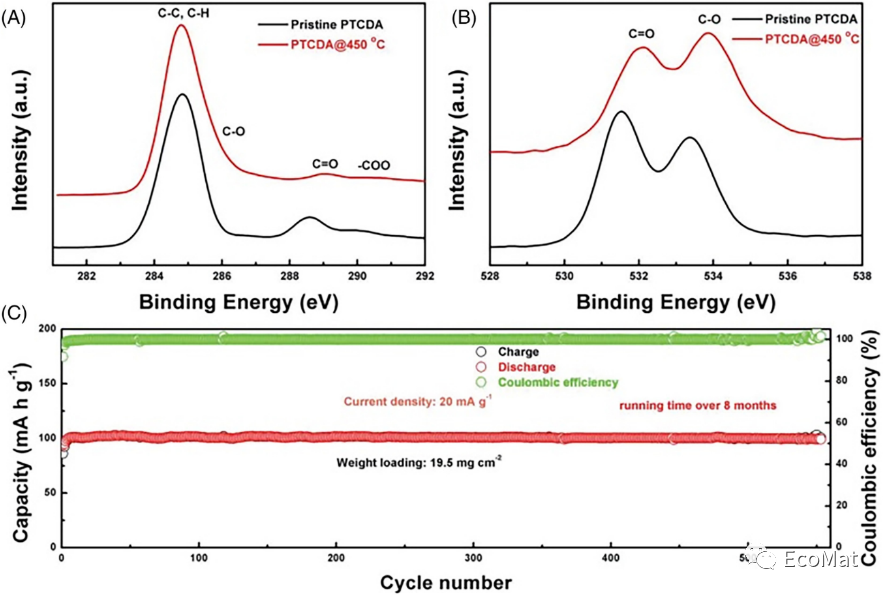
FIGURE 2 High-resolution (A) C1s and (B) O1s XPS spectra and (C) cycle performance of PTCDA@450°C (mass loading: 19.5 mg/cm2).
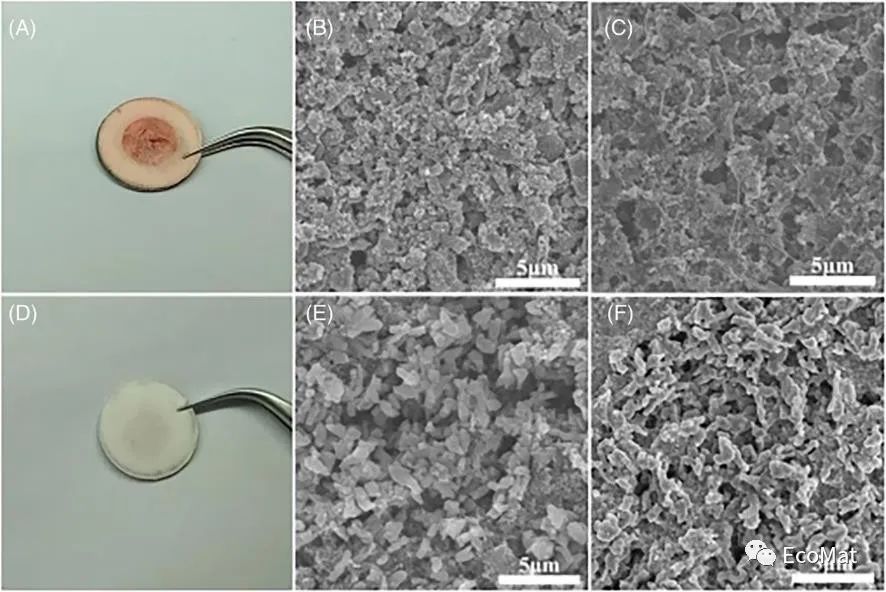
FIGURE 3 Photographs of separators in batteries with (A) an AQ cathode (1 cycle) and (D) an AQDS cathode (10 cycles). Scanning electron microscopy images of the AQ cathode (B) before and (C) after 1 cycle and the AQDS cathode (E) before and (F) after 10 cycles
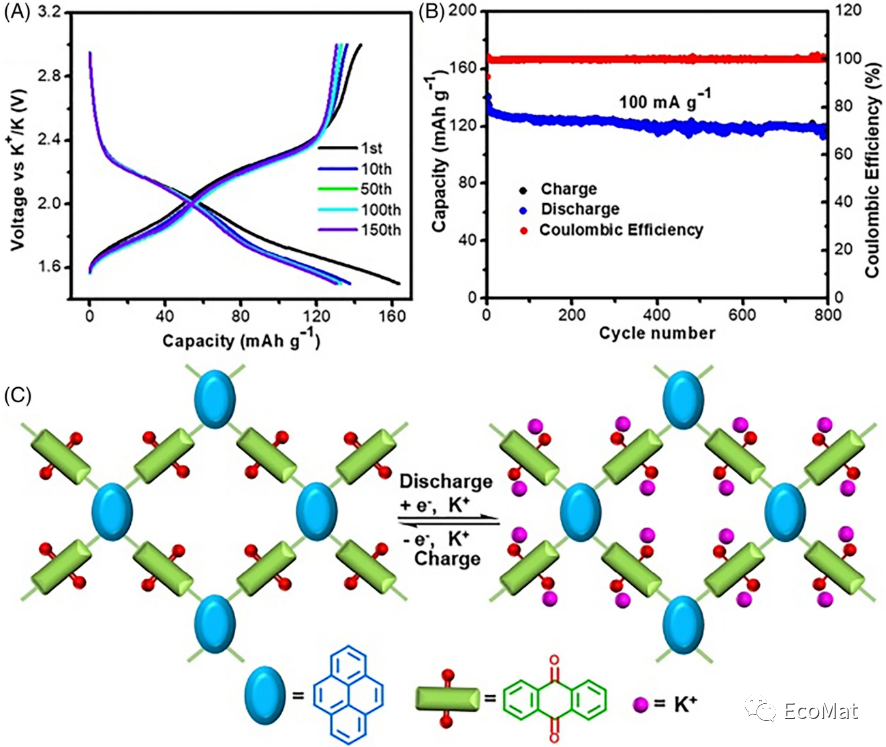
FIGURE 4 (A) Charge and discharge curves and (B) long cycling behavior of PyAq in KIBs (100 mA/g). (C) Reaction mechanism of PyAq.
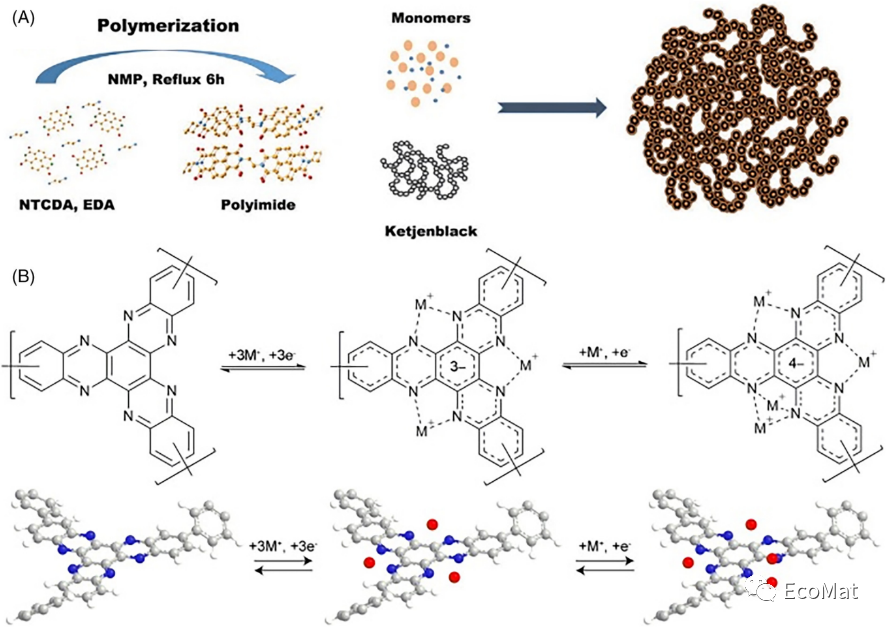
FIGURE 5 (A) Illustration of the PIM@KB synthetic process. (B) Discharge/charge mechanism of the P1 structural unit.
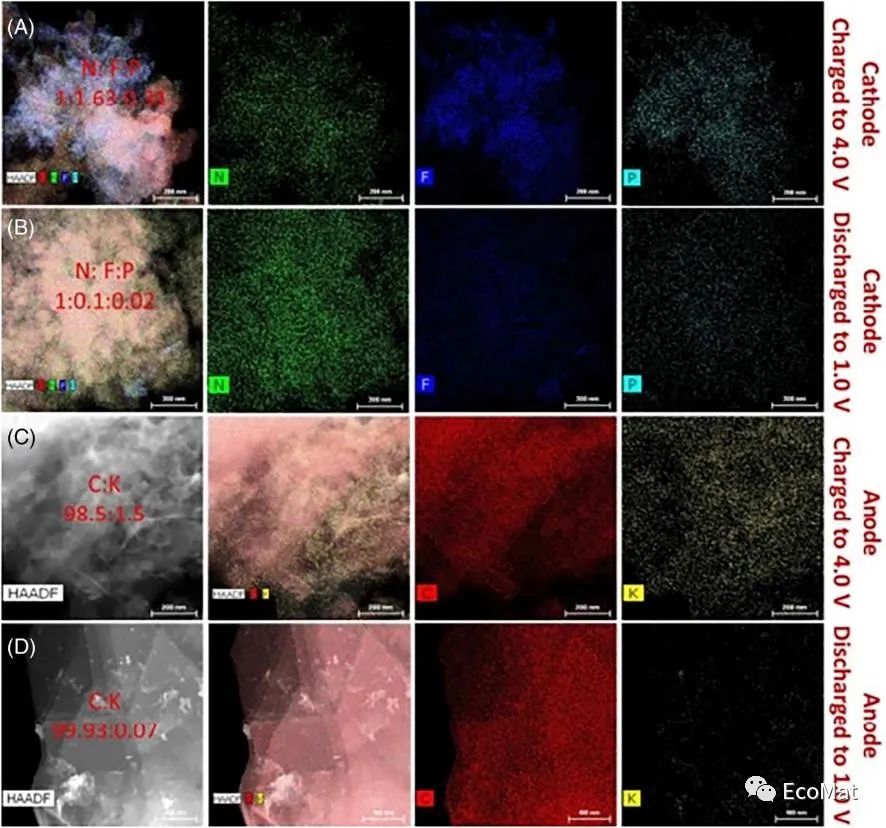
FIGURE 6 Elemental mapping of the (A) PTPAn cathode charged to 4.0 V and (B) discharged to 1.0 V in the first cycle. Elemental mapping of the (C) graphite anode charged to 4.0 V and (D) discharged to 1.0 V in the first cycle. The scale bars in A–D are 200, 300, 200, and 400 nm, respectively.
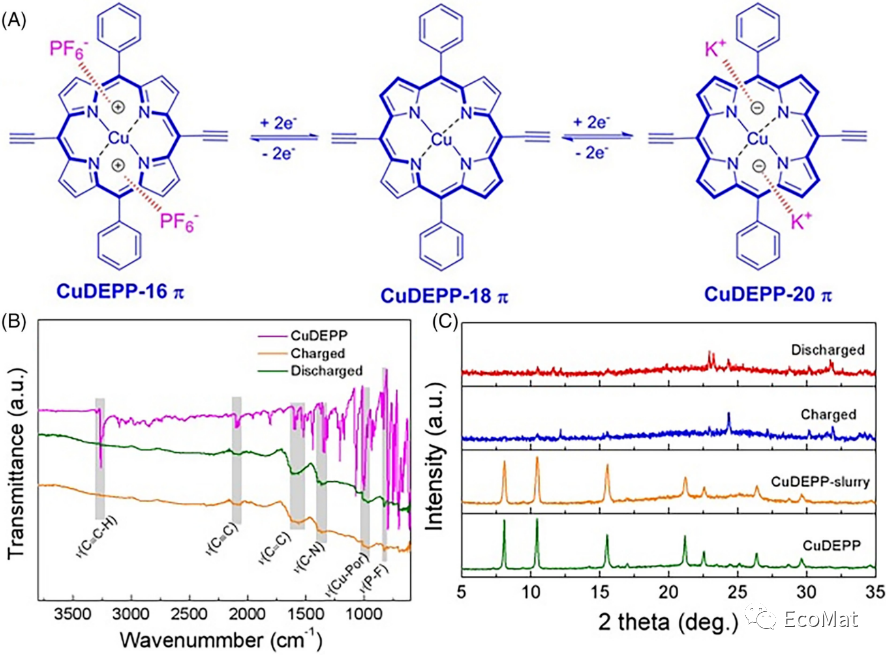
FIGURE 7 Reaction mechanism of the copper porphyrin complex in KIBs. (A) Schematic illustration of a K/KPF6/CuDEPP half-battery. (B) FTIR spectra and (C) XRD patterns of CuDEPP in the various charged states in the initial cycle.
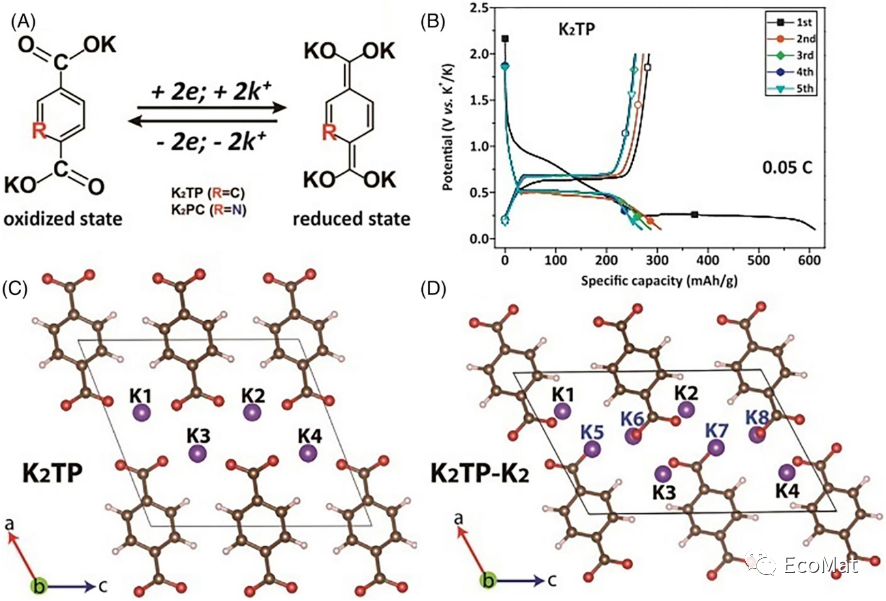
FIGURE 8 (A) K+ intercalation/deintercalation mechanisms of K2TP and K2PC. (B) Galvanostatic discharge–charge curves of K2TP. Lattice structural calculations for (C) K2TP and (D) K2TP-K2.
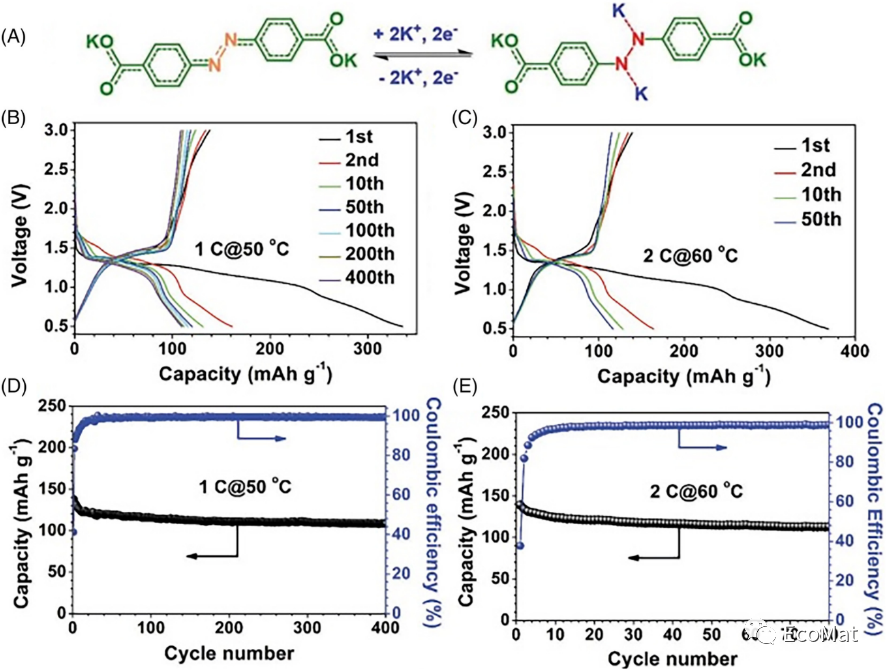
FIGURE 9 (A) Reaction of ADAPTS in KIBs. Charge/discharge curves and cycling performance (B, D) at 1C and 50°C and (C, E) at 2C and 60°C.
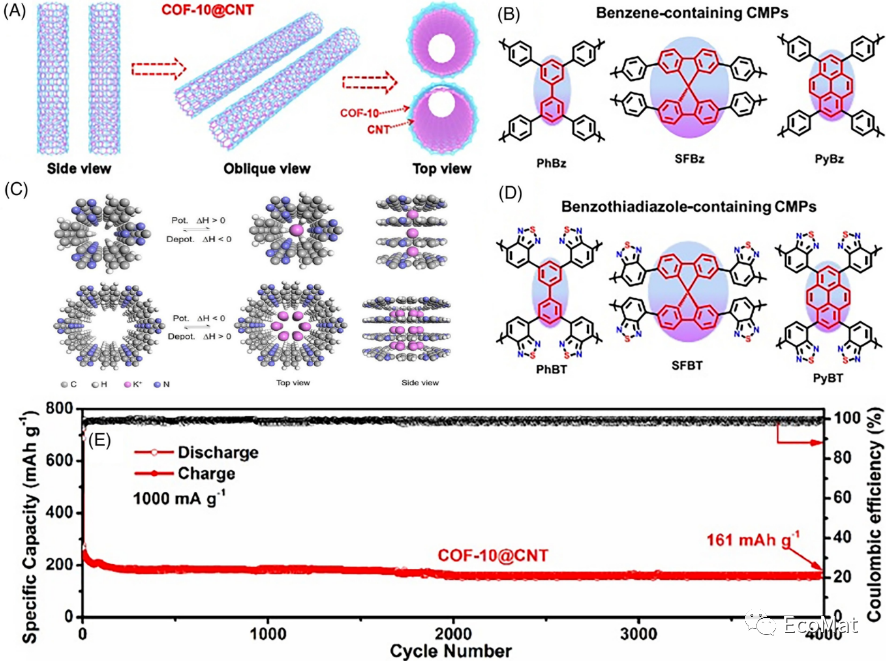
FIGURE 10 (A) Structures and (E) cycling performance of COF-10@CNTs under 1000 mA/g. (B) Illustration of the formation of CTF-0 and CTF-1 with different pore sizes. Structures of (C) Bz-containing and (D) BT-containing CMPs.
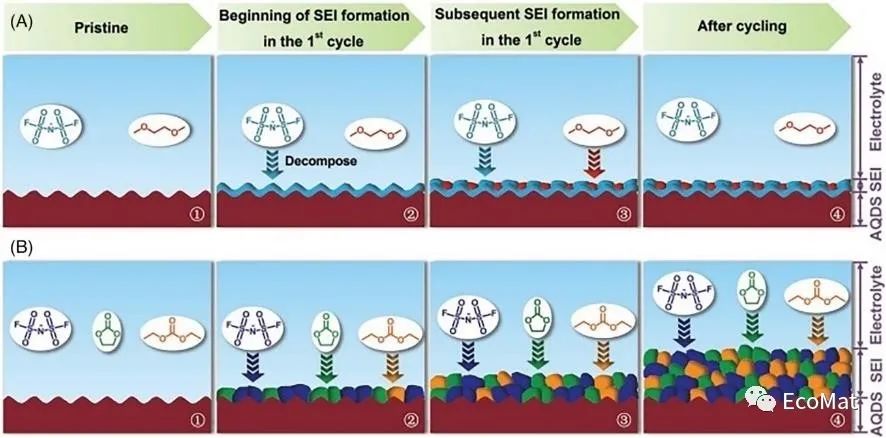
FIGURE 11 Diagram of SEI formation during the initial cycle (1,2,3) and its growth (4) in the following cycles with (A) DME and (B) EC/DEC electrolytes.
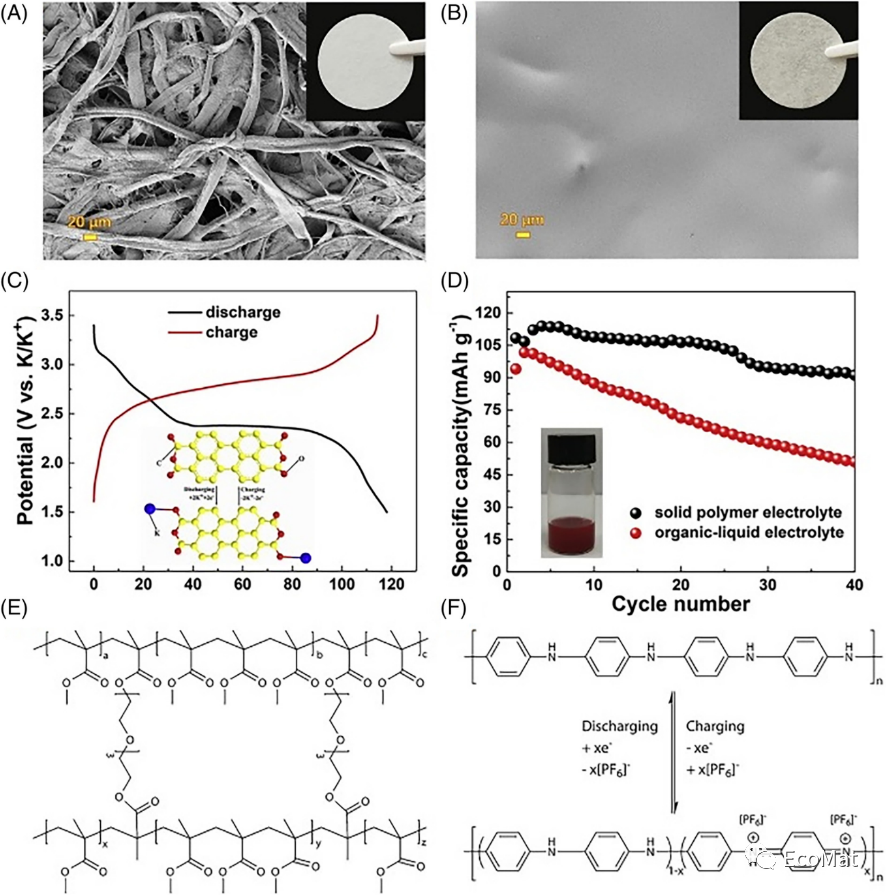
FIGURE 12 SEM and digital pictures of the (A) nonwoven cellulose membrane and (B) PPCB-SPE. (C) Charge–discharge curves of PTCDA with PPCB-SPE under 10 mA/g. (D) Cycling performance of PTCDA with PPCB-SPE and an organic-liquid electrolyte at 20 mA/g. (E) Chemical structure of PMMA in the polymer-gel electrolyte. (F) Charge storage mechanism of a polyaniline cathode in KIBs.
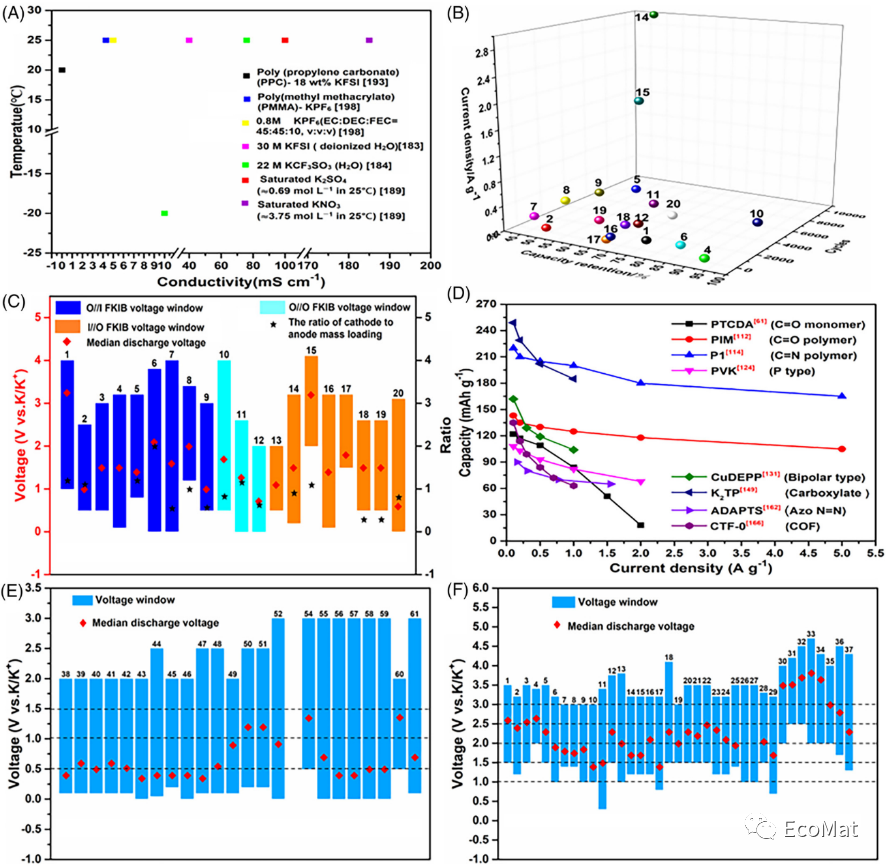
FIGURE 13 (A) Ionic conductivity of different electrolytes. (B) Cycling performance of FKIBs (the numbers in the figure correspond to those in Table 2). (C) Voltage window, average discharge voltage and mass loading of electrodes for FKIBs. (D) Rate performance of various organic electrode materials. Voltage window and average discharge voltage of (E) organic cathode and (F) anode materials.
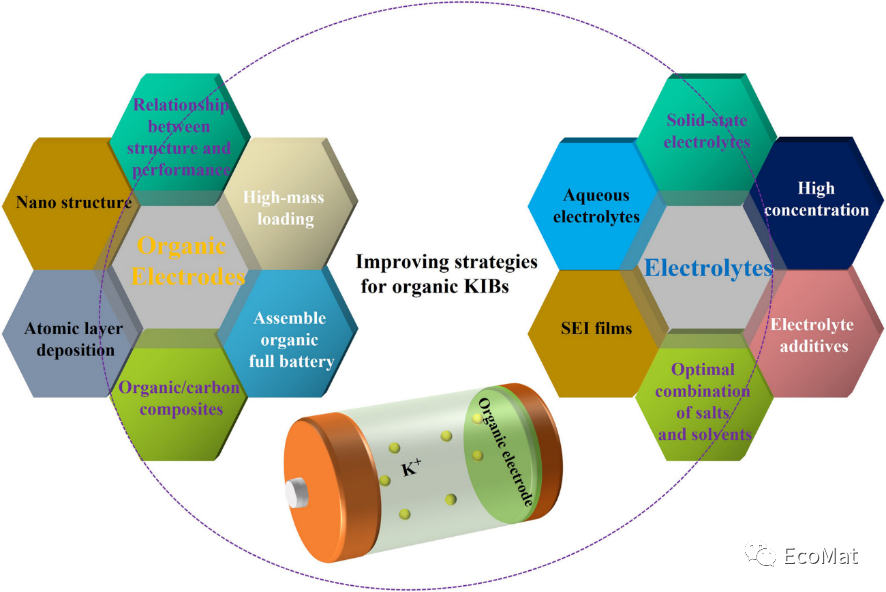
FIGURE 14 Schematic diagram of organic KIB improvement strategies.
审核编辑:刘清
-
锂离子电池有机正极材料2022-11-14 2665
-
潜力巨大的有机液流电池2025-03-06 2351
-
有机电致发光器件中新型芴类小分子材料的光谱特性2010-04-22 1976
-
动力锂离子电池安全技术的进展2013-05-29 4134
-
锂离子电池的基本组成及关键材料2013-07-03 4222
-
有机化合物可作为锂离子电池正极材料2015-11-17 5473
-
关于锂电池电极材料SEM测试、氩离子截面解剖电极片2017-07-07 9180
-
中科院就有机电极材料设计研究方面取得突破性进展2018-07-06 6376
-
我国在新型高性能钾离子电池的负极材料研究方面取得新进展2020-03-23 1738
-
有机电极材料在锂离子电池中的应用前景分析2020-04-20 5644
-
水系钾离子电池(AKIB)的最新进展2022-08-23 3973
-
分子结构与光电性质之间的关系2022-08-26 3383
-
A2-TM-PTtSA CPs用作电极材料来存储锂/钠/钾离子2022-08-29 1249
-
有机半导体材料的分子结构与性能之间的关系2023-05-23 3071
-
钾离子辅助的多阴离子材料—钠离子电池长循环稳定性的新机制2024-12-04 2000
全部0条评论

快来发表一下你的评论吧 !

