

如何使用perf性能分析工具
描述
在功能上,perf很强大,可以对众多的软硬件事件采样,还能采集出跟踪点(trace points)的信息(比如系统调用、TCP/IP事件和文件系统操作。perf的代码和Linux内核代码放在一起,是内核级的工具。perf是在Linux上做剖析分析的首选工具。
perf命令介绍
perf 工具提供了一组丰富的命令来收集和分析性能和跟踪数据。perf支持的命令如下:
The most commonly used perf commands are:
annotate Read perf.data (created by perf record) and display annotated code
archive Create archive with object files with build-ids found in perf.data file
bench General framework for benchmark suites
buildid-cache Manage build-id cache.
buildid-list List the buildids in a perf.data file
c2c Shared Data C2C/HITM Analyzer.
config Get and set variables in a configuration file.
data Data file related processing
diff Read perf.data files and display the differential profile
evlist List the event names in a perf.data file
ftrace simple wrapper for kernel's ftrace functionality
inject Filter to augment the events stream with additional information
kallsyms Searches running kernel for symbols
kmem Tool to trace/measure kernel memory properties
kvm Tool to trace/measure kvm guest os
list List all symbolic event types
lock Analyze lock events
mem Profile memory accesses
record Run a command and record its profile into perf.data
report Read perf.data (created by perf record) and display the profile
sched Tool to trace/measure scheduler properties (latencies)
script Read perf.data (created by perf record) and display trace output
stat Run a command and gather performance counter statistics
test Runs sanity tests.
timechart Tool to visualize total system behavior during a workload
top System profiling tool.
version display the version of perf binary
probe Define new dynamic tracepoints
trace strace inspired tool
annotate:读取 perf.data(由 perf record记录)并显示带注释的代码,需要在编译应用程序时加入-g选项
archive:用perf.data文件中找到的build-ids的对象文件创建档案。
bench:对系统调度、内存访问、epoll、Futex等进行压力测试。
buildid-cache: 管理build-id缓存
buildid-list:列出perf.data文件中的buildids。
c2c:共享数据C2C/HITM分析仪。
config:读取或设置配置文件中的变量
data:数据文件相关处理
diff: 读取perf.data文件并显示差分曲线
ftrace:内核的ftrace功能的简单封装器
inject:用额外的信息来增加事件流的过滤器
kallsyms:搜索运行中的内核中的符号
kmem:追踪/测量内核内存属性的工具
kvm: 追踪/测量kvm客户操作系统的工具
list:列出所有象征性的事件类型
lock:分析锁事件
mem:分析内存访问
record:将所有的分析记录进perf.data
report:读取perf.data(由perf记录创建)并显示概况
sched:跟踪/测量调度器属性(延迟)的工具
script: 读取perf.data(由perf记录创建)并显示跟踪输出
stat:运行一个命令并收集性能计数器的统计数据
test:测试系统内核支持的功能
timechart:在工作负载期间可视化整个系统行为的工具
top:系统分析工具
probe:定义新的动态跟踪点
trace:strace启发的工具
测试程序:
测试程序会一直循环打印a的值,打印一次睡眠一次。我们使用gcc test.c -g -o test将其编译成可执行文件。下面我们将结合此测试程序来使用perf工具进行分析。
void print(void)
{
int i = 0;
while(1){
i++;
}
}
int main ()
{
print();
return 0;
}
list
list命令会列举出perf支持监测的所有事件。
branch-instructions OR branches [Hardware event]
branch-misses [Hardware event]
bus-cycles [Hardware event]
cache-misses [Hardware event]
cache-references [Hardware event]
cpu-cycles OR cycles [Hardware event]
instructions [Hardware event]
alignment-faults [Software event]
bpf-output [Software event]
context-switches OR cs [Software event]
cpu-clock [Software event]
cpu-migrations OR migrations [Software event]
dummy [Software event]
emulation-faults [Software event]
major-faults [Software event]
minor-faults [Software event]
page-faults OR faults [Software event]
task-clock [Software event]
duration_time [Tool event]
L1-dcache-load-misses [Hardware cache event]
L1-dcache-loads [Hardware cache event]
L1-icache-load-misses [Hardware cache event]
L1-icache-loads [Hardware cache event]
branch-load-misses [Hardware cache event]
branch-loads [Hardware cache event]
dTLB-load-misses [Hardware cache event]
iTLB-load-misses [Hardware cache event]
br_immed_retired OR armv8_pmuv3/br_immed_retired/ [Kernel PMU event]
br_mis_pred OR armv8_pmuv3/br_mis_pred/ [Kernel PMU event]
br_pred OR armv8_pmuv3/br_pred/ [Kernel PMU event]
bus_access OR armv8_pmuv3/bus_access/ [Kernel PMU event]
bus_cycles OR armv8_pmuv3/bus_cycles/ [Kernel PMU event]
cid_write_retired OR armv8_pmuv3/cid_write_retired/ [Kernel PMU event]
cpu_cycles OR armv8_pmuv3/cpu_cycles/ [Kernel PMU event]
exc_return OR armv8_pmuv3/exc_return/ [Kernel PMU event]
exc_taken OR armv8_pmuv3/exc_taken/ [Kernel PMU event]
inst_retired OR armv8_pmuv3/inst_retired/ [Kernel PMU event]
l1d_cache OR armv8_pmuv3/l1d_cache/ [Kernel PMU event]
l1d_cache_refill OR armv8_pmuv3/l1d_cache_refill/ [Kernel PMU event]
l1d_cache_wb OR armv8_pmuv3/l1d_cache_wb/ [Kernel PMU event]
l1d_tlb_refill OR armv8_pmuv3/l1d_tlb_refill/ [Kernel PMU event]
l1i_cache OR armv8_pmuv3/l1i_cache/ [Kernel PMU event]
l1i_cache_refill OR armv8_pmuv3/l1i_cache_refill/ [Kernel PMU event]
l1i_tlb_refill OR armv8_pmuv3/l1i_tlb_refill/ [Kernel PMU event]
l2d_cache OR armv8_pmuv3/l2d_cache/ [Kernel PMU event]
l2d_cache_refill OR armv8_pmuv3/l2d_cache_refill/ [Kernel PMU event]
l2d_cache_wb OR armv8_pmuv3/l2d_cache_wb/ [Kernel PMU event]
ld_retired OR armv8_pmuv3/ld_retired/ [Kernel PMU event]
mem_access OR armv8_pmuv3/mem_access/ [Kernel PMU event]
memory_error OR armv8_pmuv3/memory_error/ [Kernel PMU event]
pc_write_retired OR armv8_pmuv3/pc_write_retired/ [Kernel PMU event]
st_retired OR armv8_pmuv3/st_retired/ [Kernel PMU event]
sw_incr OR armv8_pmuv3/sw_incr/ [Kernel PMU event]
unaligned_ldst_retired OR armv8_pmuv3/unaligned_ldst_retired/ [Kernel PMU event]
cs_etm// [Kernel PMU event]
imx8_ddr0/activate/ [Kernel PMU event]
imx8_ddr0/axid-read/ [Kernel PMU event]
imx8_ddr0/axid-write/ [Kernel PMU event]
imx8_ddr0/cycles/ [Kernel PMU event]
imx8_ddr0/hp-read-credit-cnt/ [Kernel PMU event]
imx8_ddr0/hp-read/ [Kernel PMU event]
imx8_ddr0/hp-req-nocredit/ [Kernel PMU event]
imx8_ddr0/hp-xact-credit/ [Kernel PMU event]
imx8_ddr0/load-mode/ [Kernel PMU event]
imx8_ddr0/lp-read-credit-cnt/ [Kernel PMU event]
imx8_ddr0/lp-req-nocredit/ [Kernel PMU event]
imx8_ddr0/lp-xact-credit/ [Kernel PMU event]
imx8_ddr0/perf-mwr/ [Kernel PMU event]
imx8_ddr0/precharge/ [Kernel PMU event]
imx8_ddr0/raw-hazard/ [Kernel PMU event]
imx8_ddr0/read-accesses/ [Kernel PMU event]
imx8_ddr0/read-activate/ [Kernel PMU event]
imx8_ddr0/read-command/ [Kernel PMU event]
imx8_ddr0/read-cycles/ [Kernel PMU event]
imx8_ddr0/read-modify-write-command/ [Kernel PMU event]
imx8_ddr0/read-queue-depth/ [Kernel PMU event]
imx8_ddr0/read-write-transition/ [Kernel PMU event]
imx8_ddr0/read/ [Kernel PMU event]
imx8_ddr0/refresh/ [Kernel PMU event]
imx8_ddr0/selfresh/ [Kernel PMU event]
imx8_ddr0/wr-xact-credit/ [Kernel PMU event]
imx8_ddr0/write-accesses/ [Kernel PMU event]
imx8_ddr0/write-command/ [Kernel PMU event]
imx8_ddr0/write-credit-cnt/ [Kernel PMU event]
imx8_ddr0/write-cycles/ [Kernel PMU event]
imx8_ddr0/write-queue-depth/ [Kernel PMU event]
imx8_ddr0/write/ [Kernel PMU event]
branch:
br_cond
[Conditional branch executed]
br_cond_mispred
[Conditional branch mispredicted]
br_indirect_mispred
[Indirect branch mispredicted]
br_indirect_mispred_addr
[Indirect branch mispredicted because of address miscompare]
br_indirect_spec
[Branch speculatively executed, indirect branch]
bus:
bus_access_rd
[Bus access read]
bus_access_wr
[Bus access write]
cache:
ext_snoop
[SCU Snooped data from another CPU for this CPU]
prefetch_linefill
[Linefill because of prefetch]
prefetch_linefill_drop
[Instruction Cache Throttle occurred]
read_alloc
[Read allocate mode]
read_alloc_enter
[Entering read allocate mode]
memory:
ext_mem_req
[External memory request]
ext_mem_req_nc
[Non-cacheable external memory request]
other:
exc_fiq
[Exception taken, FIQ]
exc_irq
[Exception taken, IRQ]
l1d_cache_err
[L1 Data Cache (data, tag or dirty) memory error, correctable or non-correctable]
l1i_cache_err
[L1 Instruction Cache (data or tag) memory error]
pre_decode_err
[Pre-decode error]
tlb_err
[TLB memory error]
pipeline:
agu_dep_stall
[Cycles there is an interlock for a load/store instruction waiting for data to calculate the address in the
AGU]
decode_dep_stall
[Cycles the DPU IQ is empty and there is a pre-decode error being processed]
ic_dep_stall
[Cycles the DPU IQ is empty and there is an instruction cache miss being processed]
iutlb_dep_stall
[Cycles the DPU IQ is empty and there is an instruction micro-TLB miss being processed]
ld_dep_stall
[Cycles there is a stall in the Wr stage because of a load miss]
other_interlock_stall
[Cycles there is an interlock other than Advanced SIMD/Floating-point instructions or load/store instruction]
other_iq_dep_stall
[Cycles that the DPU IQ is empty and that is not because of a recent micro-TLB miss, instruction cache miss or
pre-decode error]
simd_dep_stall
[Cycles there is an interlock for an Advanced SIMD/Floating-point operation]
st_dep_stall
[Cycles there is a stall in the Wr stage because of a store]
stall_sb_full
[Data Write operation that stalls the pipeline because the store buffer is full]
rNNN [Raw hardware event descriptor]
cpu/t1=v1[,t2=v2,t3 ...]/modifier [Raw hardware event descriptor]
(see 'man perf-list' on how to encode it)
mem:[/len][:access] [Hardware breakpoint]
Metric Groups:
No_group:
imx8mp_bandwidth_usage.lpddr4
[bandwidth usage for lpddr4 evk board. Unit: imx8_ddr ]
imx8mp_ddr_read.2d
[bytes of gpu 2d read from ddr. Unit: imx8_ddr ]
imx8mp_ddr_read.3d
[bytes of gpu 3d read from ddr. Unit: imx8_ddr ]
imx8mp_ddr_read.a53
[bytes of a53 core read from ddr. Unit: imx8_ddr ]
imx8mp_ddr_read.all
[bytes of all masters read from ddr. Unit: imx8_ddr ]
imx8mp_ddr_read.audio_dsp
[bytes of audio dsp read from ddr. Unit: imx8_ddr ]
imx8mp_ddr_read.audio_sdma2_burst
[bytes of audio sdma2_burst read from ddr. Unit: imx8_ddr ]
imx8mp_ddr_read.audio_sdma2_per
[bytes of audio sdma2_per read from ddr. Unit: imx8_ddr ]
imx8mp_ddr_read.audio_sdma3_burst
[bytes of audio sdma3_burst read from ddr. Unit: imx8_ddr ]
imx8mp_ddr_read.audio_sdma3_per
[bytes of audio sdma3_per read from ddr. Unit: imx8_ddr ]
imx8mp_ddr_read.audio_sdma_pif
[bytes of audio sdma_pif read from ddr. Unit: imx8_ddr ]
imx8mp_ddr_read.dewarp
[bytes of display dewarp read from ddr. Unit: imx8_ddr ]
imx8mp_ddr_read.hdmi_hdcp
[bytes of hdmi_tx tx_hdcp read from ddr. Unit: imx8_ddr ]
imx8mp_ddr_read.hdmi_hrv_mwr
[bytes of hdmi_tx hrv_mwr read from ddr. Unit: imx8_ddr ]
imx8mp_ddr_read.hdmi_lcdif
[bytes of hdmi_tx lcdif read from ddr. Unit: imx8_ddr ]
imx8mp_ddr_read.isi1
[bytes of display isi1 read from ddr. Unit: imx8_ddr ]
imx8mp_ddr_read.isi2
[bytes of display isi2 read from ddr. Unit: imx8_ddr ]
imx8mp_ddr_read.isi3
[bytes of display isi3 read from ddr. Unit: imx8_ddr ]
imx8mp_ddr_read.isp1
[bytes of display isp1 read from ddr. Unit: imx8_ddr ]
imx8mp_ddr_read.isp2
[bytes of display isp2 read from ddr. Unit: imx8_ddr ]
imx8mp_ddr_read.lcdif1
[bytes of display lcdif1 read from ddr. Unit: imx8_ddr ]
imx8mp_ddr_read.lcdif2
[bytes of display lcdif2 read from ddr. Unit: imx8_ddr ]
imx8mp_ddr_read.npu
[bytes of npu read from ddr. Unit: imx8_ddr ]
imx8mp_ddr_read.pci
[bytes of hsio pci read from ddr. Unit: imx8_ddr ]
imx8mp_ddr_read.supermix
[bytes of supermix(m7) core read from ddr. Unit: imx8_ddr ]
imx8mp_ddr_read.usb1
[bytes of hsio usb1 read from ddr. Unit: imx8_ddr ]
imx8mp_ddr_read.usb2
[bytes of hsio usb2 read from ddr. Unit: imx8_ddr ]
imx8mp_ddr_read.vpu1
[bytes of vpu1 read from ddr. Unit: imx8_ddr ]
imx8mp_ddr_read.vpu2
[bytes of vpu2 read from ddr. Unit: imx8_ddr ]
imx8mp_ddr_read.vpu3
[bytes of vpu3 read from ddr. Unit: imx8_ddr ]
imx8mp_ddr_write.2d
[bytes of gpu 2d write to ddr. Unit: imx8_ddr ]
imx8mp_ddr_write.3d
[bytes of gpu 3d write to ddr. Unit: imx8_ddr ]
imx8mp_ddr_write.a53
[bytes of a53 core write to ddr. Unit: imx8_ddr ]
imx8mp_ddr_write.all
[bytes of all masters write to ddr. Unit: imx8_ddr ]
imx8mp_ddr_write.audio_dsp
[bytes of audio dsp write to ddr. Unit: imx8_ddr ]
imx8mp_ddr_write.audio_sdma2_burst
[bytes of audio sdma2_burst write to ddr. Unit: imx8_ddr ]
imx8mp_ddr_write.audio_sdma2_per
[bytes of audio sdma2_per write to ddr. Unit: imx8_ddr ]
imx8mp_ddr_write.audio_sdma3_burst
[bytes of audio sdma3_burst write to ddr. Unit: imx8_ddr ]
imx8mp_ddr_write.audio_sdma3_per
[bytes of audio sdma3_per write to ddr. Unit: imx8_ddr ]
imx8mp_ddr_write.audio_sdma_pif
[bytes of audio sdma_pif write to ddr. Unit: imx8_ddr ]
imx8mp_ddr_write.dewarp
[bytes of display dewarp write to ddr. Unit: imx8_ddr ]
imx8mp_ddr_write.hdmi_hdcp
[bytes of hdmi_tx tx_hdcp write to ddr. Unit: imx8_ddr ]
imx8mp_ddr_write.hdmi_hrv_mwr
[bytes of hdmi_tx hrv_mwr write to ddr. Unit: imx8_ddr ]
imx8mp_ddr_write.hdmi_lcdif
[bytes of hdmi_tx lcdif write to ddr. Unit: imx8_ddr ]
imx8mp_ddr_write.isi1
[bytes of display isi1 write to ddr. Unit: imx8_ddr ]
imx8mp_ddr_write.isi2
[bytes of display isi2 write to ddr. Unit: imx8_ddr ]
imx8mp_ddr_write.isi3
[bytes of display isi3 write to ddr. Unit: imx8_ddr ]
imx8mp_ddr_write.isp2
[bytes of display isp2 write to ddr. Unit: imx8_ddr ]
imx8mp_ddr_write.lcdif1
[bytes of display lcdif1 write to ddr. Unit: imx8_ddr ]
imx8mp_ddr_write.lcdif2
[bytes of display lcdif2 write to ddr. Unit: imx8_ddr ]
imx8mp_ddr_write.npu
[bytes of npu write to ddr. Unit: imx8_ddr ]
imx8mp_ddr_write.pci
[bytes of hsio pci write to ddr. Unit: imx8_ddr ]
imx8mp_ddr_write.supermix
[bytes of supermix(m7) write to ddr. Unit: imx8_ddr ]
imx8mp_ddr_write.usb1
[bytes of hsio usb1 write to ddr. Unit: imx8_ddr ]
imx8mp_ddr_write.usb2
[bytes of hsio usb2 write to ddr. Unit: imx8_ddr ]
imx8mp_ddr_write.vpu1
[bytes of vpu1 write to ddr. Unit: imx8_ddr ]
imx8mp_ddr_write.vpu2
[bytes of vpu2 write to ddr. Unit: imx8_ddr ]
imx8mp_ddr_write.vpu3
[bytes of vpu3 write to ddr. Unit: imx8_ddr ]
imx8_ddr_DDR_MON:
imx8mp_ddr_write.isp1
[bytes of display isp1 write to ddr. Unit: imx8_ddr ]
stat
我们可以使用stat来采集程序的运行时间和CPU开销,perf stat所支持的主要参数如下:
-A, --no-aggr disable CPU count aggregation
-B, --big-num print large numbers with thousands' separators
-C, --cpu list of cpus to monitor in system-wide
-D, --delay ms to wait before starting measurement after program start (-1: start with events disabled)
-d, --detailed detailed run - start a lot of events
-e, --event event selector. use 'perf list' to list available events
-G, --cgroup monitor event in cgroup name only
-g, --group put the counters into a counter group
-I, --interval-print
print counts at regular interval in ms (overhead is possible for values <= 100ms)
-i, --no-inherit child tasks do not inherit counters
-M, --metrics
monitor specified metrics or metric groups (separated by ,)
-n, --null null run - dont start any counters
-o, --output output file name
-p, --pid stat events on existing process id
-r, --repeat repeat command and print average + stddev (max: 100, forever: 0)
-S, --sync call sync() before starting a run
-t, --tid stat events on existing thread id
-T, --transaction hardware transaction statistics
-v, --verbose be more verbose (show counter open errors, etc)
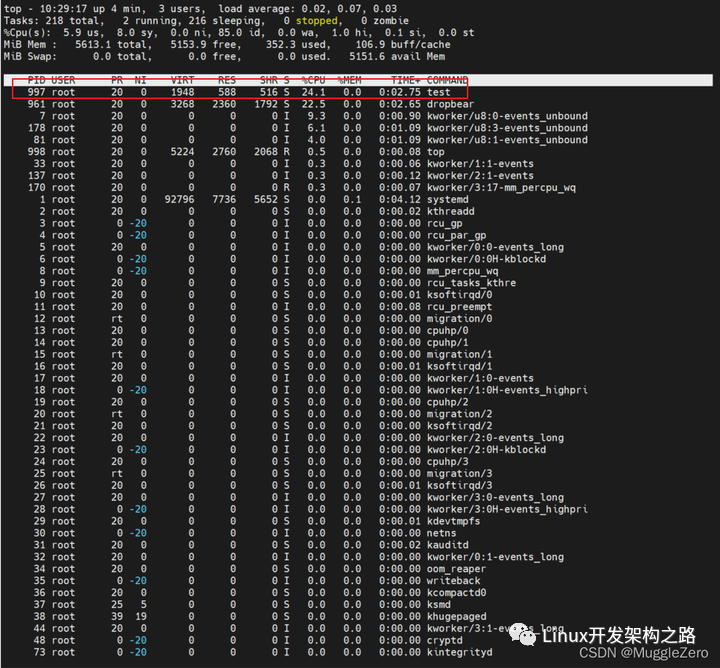
先运行测试程序,然后使用top命令查看应用程序对应的pid,例如这里的pid是997。
那么我们就来采集这个应用程序的运行信息:
由于测试程序是死循环,所以最后打印的时间是执行stat命令的总时间。输出中还显示了task-clock (msec)是22624.22毫秒,也就是22s。
22624.22 msec task-clock # 0.188 CPUs utilized
1225 context-switches # 0.054 K/sec
1 cpu-migrations # 0.000 K/sec
0 page-faults # 0.000 K/sec
39516466339 cycles # 1.747 GHz
23012315521 instructions # 0.58 insn per cycle
3381064757 branches # 149.444 M/sec
256850857 branch-misses # 7.60% of all branches
120.484878500 seconds time elapsed
record
剖析采样可以帮助我们采集到程序运行的特征,而且剖析精度非常高,可以定位到具体的代码行和指令块。
-b, --branch-any sample any taken branches
-B, --no-buildid do not collect buildids in perf.data
-c, --count event period to sample
-C, --cpu list of cpus to monitor
-d, --data Record the sample addresses
-D, --delay ms to wait before starting measurement after program start (-1: start with events disabled)
-e, --event event selector. use 'perf list' to list available events
-F, --freq
profile at this frequency
-g enables call-graph recording
-G, --cgroup monitor event in cgroup name only
-I, --intr-regs[=]
sample selected machine registers on interrupt, use '-I?' to list register names
-i, --no-inherit child tasks do not inherit counters
-j, --branch-filter
branch stack filter modes
-k, --clockid
clockid to use for events, see clock_gettime()
-m, --mmap-pages
number of mmap data pages and AUX area tracing mmap pages
-N, --no-buildid-cache
do not update the buildid cache
-n, --no-samples don't sample
-o, --output output file name
-P, --period Record the sample period
-p, --pid record events on existing process id
-q, --quiet don't print any message
-R, --raw-samples collect raw sample records from all opened counters
-r, --realtime collect data with this RT SCHED_FIFO priority
-S, --snapshot[=]
AUX area tracing Snapshot Mode
-s, --stat per thread counts
-t, --tid record events on existing thread id
-T, --timestamp Record the sample timestamps
-u, --uid user to profile
-v, --verbose be more verbose (show counter open errors, etc)[,pages]>
我通过“-F 999”选项,我把采样频率设置为999Hz,每秒采样999次。
测试命令:
然后perf会将记录的数据存储在perf.data中。
report
-b, --branch-stack use branch records for per branch histogram filling
-c, --comms
only consider symbols in these comms
-C, --cpu list of cpus to profile
-d, --dsos
only consider symbols in these dsos
-D, --dump-raw-trace dump raw trace in ASCII
-F, --fields
output field(s): overhead period sample overhead overhead_sys
overhead_us overhead_guest_sys overhead_guest_us overhead_children
sample period pid comm dso symbol parent cpu socket
srcline srcfile local_weight weight transaction trace
symbol_size dso_size cgroup cgroup_id ipc_null time
dso_from dso_to symbol_from symbol_to mispredict abort
in_tx cycles srcline_from srcline_to ipc_lbr symbol_daddr
dso_daddr locked tlb mem snoop dcacheline symbol_iaddr
phys_daddr
-f, --force don't complain, do it
-g, --call-graph
Display call graph (stack chain/backtrace):
print_type: call graph printing style (graph|flat|fractal|folded|none)
threshold: minimum call graph inclusion threshold ()
print_limit: maximum number of call graph entry ()
order: call graph order (caller|callee)
sort_key: call graph sort key (function|address)
branch: include last branch info to call graph (branch)
value: call graph value (percent|period|count)
Default: graph,0.5,caller,function,percent
-G, --inverted alias for inverted call graph
-i, --input input file name
-I, --show-info Display extended information about perf.data file
-k, --vmlinux vmlinux pathname
-M, --disassembler-style
Specify disassembler style (e.g. -M intel for intel syntax)
-m, --modules load module symbols - WARNING: use only with -k and LIVE kernel
-n, --show-nr-samples
Show a column with the number of samples
-p, --parent regex filter to identify parent, see: '--sort parent'
-q, --quiet Do not show any message
-s, --sort
sort by key(s): overhead overhead_sys overhead_us overhead_guest_sys
overhead_guest_us overhead_children sample period
pid comm dso symbol parent cpu socket srcline srcfile
local_weight weight transaction trace symbol_size
dso_size cgroup cgroup_id ipc_null time dso_from dso_to
symbol_from symbol_to mispredict abort in_tx cycles
srcline_from srcline_to ipc_lbr symbol_daddr dso_daddr
locked tlb mem snoop dcacheline symbol_iaddr phys_daddr
-S, --symbols
only consider these symbols
-t, --field-separator
separator for columns, no spaces will be added between columns '.' is reserved.
-T, --threads Show per-thread event counters
-U, --hide-unresolved
Only display entries resolved to a symbol
-v, --verbose be more verbose (show symbol address, etc)
-w, --column-widths
don't try to adjust column width, use these fixed values
-x, --exclude-other Only display entries with parent-match
--asm-raw Display raw encoding of assembly instructions (default)
--branch-history add last branch records to call history
--children Accumulate callchains of children and show total overhead as well. Enabled by default, use --no-children to disable.
--demangle Disable symbol demangling
--demangle-kernel
Enable kernel symbol demangling
--full-source-path
Show full source file name path for source lines
--group Show event group information together
--group-sort-idx
Sort the output by the event at the index n in group. If n is invalid, sort by the first event. WARNING: should be used on grouped events.
--gtk Use the GTK2 interface
--header Show data header.
--header-only Show only data header.
--hierarchy Show entries in a hierarchy
--ignore-callees
ignore callees of these functions in call graphs
--ignore-vmlinux don't load vmlinux even if found
--inline Show inline function
--itrace[=]
Instruction Tracing options
i[period]: synthesize instructions events
b: synthesize branches events (branch misses for Arm SPE)
c: synthesize branches events (calls only)
r: synthesize branches events (returns only)
x: synthesize transactions events
w: synthesize ptwrite events
p: synthesize power events
o: synthesize other events recorded due to the use
of aux-output (refer to perf record)
e[flags]: synthesize error events
each flag must be preceded by + or -
error flags are: o (overflow)
l (data lost)
d[flags]: create a debug log
each flag must be preceded by + or -
log flags are: a (all perf events)
f: synthesize first level cache events
m: synthesize last level cache events
t: synthesize TLB events
a: synthesize remote access events
g[len]: synthesize a call chain (use with i or x)
G[len]: synthesize a call chain on existing event records
l[len]: synthesize last branch entries (use with i or x)
L[len]: synthesize last branch entries on existing event records
sNUMBER: skip initial number of events
q: quicker (less detailed) decoding
PERIOD[ns|us|ms|i|t]: specify period to sample stream
concatenate multiple options. Default is ibxwpe or cewp
--kallsyms
kallsyms pathname
--max-stack Set the maximum stack depth when parsing the callchain, anything beyond the specified depth will be ignored. Default: kernel.perf_event_max_stack or 127
--mem-mode mem access profile
--mmaps Display recorded tasks memory maps
--ns Show times in nanosecs
--objdump objdump binary to use for disassembly and annotations
--percent-limit
Don't show entries under that percent
--percent-type
Set percent type local/global-period/hits
--percentage
how to display percentage of filtered entries
--pid
only consider symbols in these pids
--prefix
Add prefix to source file path names in programs (with --prefix-strip)
--prefix-strip
Strip first N entries of source file path name in programs (with --prefix)
--pretty pretty printing style key: normal raw
--raw-trace Show raw trace event output (do not use print fmt or plugins)
--samples Number of samples to save per histogram entry for individual browsing
--show-cpu-utilization
Show sample percentage for different cpu modes
--show-on-off-events
Show the on/off switch events, used with --switch-on and --switch-off
--show-ref-call-graph
Show callgraph from reference event
--show-total-period
Show a column with the sum of periods
--socket-filter
only show processor socket that match with this filter
--source Interleave source code with assembly code (default)
--stats Display event stats
--stdio Use the stdio interface
--stdio-color
'always' (default), 'never' or 'auto' only applicable to --stdio mode
--stitch-lbr Enable LBR callgraph stitching approach
--switch-off
Stop considering events after the ocurrence of this event
--switch-on
Consider events after the ocurrence of this event
--symbol-filter
only show symbols that (partially) match with this filter
--symfs
Look for files with symbols relative to this directory
--tasks Display recorded tasks
--tid
only consider symbols in these tids
--time Time span of interest (start,stop)
--time-quantum
Set time quantum for time sort key (default 100ms)
--total-cycles Sort all blocks by 'Sampled Cycles%'
--tui Use the TUI interface[,tid...]>[,pid...]>|absolute>[,width...]>[,symbol...]>[,key2...]>,threshold[,print_limit],order,sort_key[,branch],value>[,keys...]>[,dso...]>[,comm...]>
采集完数据,我们就可以通过perf report命令寻找采样中的性能瓶颈了。
Overhead Command Shared Object Symbol
99.99% test test [.] print •
0.00% test [kernel.kallsyms] [k] update_sd_lb_stats.constprop.0 ▒
0.00% test [kernel.kallsyms] [k] _raw_spin_unlock_irq ▒
0.00% test [kernel.kallsyms] [k] shift_arg_pages ▒
0.00% perf [kernel.kallsyms] [k] perf_event_exec
- Overhead:指出了该Symbol采样在总采样中所占的百分比。在当前场景下,表示了该Symbol消耗的CPU时间占总CPU时间的百分比
- Command:进程名
- Shared Object:模块名, 比如具体哪个共享库,哪个可执行程序。
- Symbol:二进制模块中的符号名,如果是高级语言,比如C语言编写的程序,等价于函数名。
只定位到函数还不够好,perf工具还能帮我们定位到更细的粒度,这样我们就不用去猜函数中哪一段代码出了问题。如果我们通过键盘上下键把光标移动到print函数上,然后敲击Enter键,perf给出了一些选项。通过这些选项,我们可以进一步分析这个函数。
我们选中第一个选项“Annotate wasteTime”,我们敲击Enter键就可以对函数做进一步分析了。
Zoom into test thread --- 聚焦到线程 test
Zoom into test DSO --- 聚焦到动态共享对象test
Browse map details --- 查看map
Run scripts for samples of thread [test]--- 针对test线程的采样运行脚本
Run scripts for samples of symbol [test] --- 针对函数的采样运行脚本
Run scripts for all samples --- 针对所有采样运行脚步
Switch to another data file in PWD --- 切换到当前目录中另一个数据文件
Exit

annotate
-C, --cpu list of cpus to profile
-d, --dsos
only consider symbols in these dsos
-D, --dump-raw-trace dump raw trace in ASCII
-f, --force don't complain, do it
-i, --input input file name
-k, --vmlinux vmlinux pathname
-l, --print-line print matching source lines (may be slow)
-M, --disassembler-style
Specify disassembler style (e.g. -M intel for intel syntax)
-m, --modules load module symbols - WARNING: use only with -k and LIVE kernel
-n, --show-nr-samples
Show a column with the number of samples
-P, --full-paths Don't shorten the displayed pathnames
-q, --quiet do now show any message
-s, --symbol
symbol to annotate[,dso...]>
我们可以使用annotate来单独分析print函数的信息,效果和report中进入annotate一样。
top
-a, --all-cpus system-wide collection from all CPUs
-b, --branch-any sample any taken branches
-c, --count event period to sample
-C, --cpu list of cpus to monitor
-d, --delay number of seconds to delay between refreshes
-D, --dump-symtab dump the symbol table used for profiling
-E, --entries display this many functions
-e, --event event selector. use 'perf list' to list available events
-f, --count-filter
only display functions with more events than this
-F, --freq
profile at this frequency
-g enables call-graph recording and display
-i, --no-inherit child tasks do not inherit counters
-j, --branch-filter
branch stack filter modes
-K, --hide_kernel_symbols
hide kernel symbols
-k, --vmlinux vmlinux pathname
-M, --disassembler-style
Specify disassembler style (e.g. -M intel for intel syntax)
-m, --mmap-pages
number of mmap data pages
-n, --show-nr-samples
Show a column with the number of samples
-p, --pid profile events on existing process id
-r, --realtime collect data with this RT SCHED_FIFO priority
-s, --sort
sort by key(s): pid, comm, dso, symbol, parent, cpu, srcline, ... Please refer the man page for the complete list.
-t, --tid profile events on existing thread id
-U, --hide_user_symbols
hide user symbols
-u, --uid user to profile
-v, --verbose be more verbose (show counter open errors, etc)
-w, --column-widths [,width...]>[,key2...]>
perf top命令和linux下的top命令有点相似,实时打印出系统中被采样事件的状态和统计数据。perf top主要用于实时剖析各个函数在某个性能 事件(event)上的热度,默认的event是cycles(cpu周期数),这样可以检测系统中所有应用层和内核层函数的热度。
perf top支持两种输出界面,tui和tty,默认是tui,因为tui需要更多的环境和库支持,所以经常出现乱码问题,所以本文都是基于tty界面分析(–stdio)。
直接执行perf top监控的是整个系统中所有进程的状态,多数情况我们只关心某个进程,或者想定位某个线程的性能问题,perf top都是支持的(-p / -t)。
需要进入函数内部一探究竟,有时对于像上面的DH_SSM_BLKBUF_ALLOC这样的函数的调用堆栈,以定位到是哪里在频繁调用。这时候可以执行:
上面的-g参数就是现实函数的调用堆栈,-k是为了只输出应用层函数
bench
bench可以来对系统性能进行评测,支持调度、系统调用、内存、epoll等各项功能测试。
perf bench [] []
# List of all available benchmark collections:
sched: Scheduler and IPC benchmarks
syscall: System call benchmarks
mem: Memory access benchmarks
futex: Futex stressing benchmarks
epoll: Epoll stressing benchmarks
internals: Perf-internals benchmarks
all: All benchmarks
如果我们使用perf bench all,会测试所有支持的测试项目。
# 20 sender and receiver processes per group
# 10 groups == 400 processes run
Total time: 0.900 [sec]
# Running sched/pipe benchmark...
# Executed 1000000 pipe operations between two processes
Total time: 15.180 [sec]
15.180503 usecs/op
65873 ops/sec
# Running syscall/basic benchmark...
# Executed 10000000 getppid() calls
Total time: 3.972 [sec]
0.397209 usecs/op
2517568 ops/sec
# Running mem/memcpy benchmark...
# function 'default' (Default memcpy() provided by glibc)
# Copying 1MB bytes ...
1.698370 GB/sec
# Running mem/memset benchmark...
# function 'default' (Default memset() provided by glibc)
# Copying 1MB bytes ...
12.207031 GB/sec
# Running mem/find_bit benchmark...
100000 operations 1 bits set of 1 bits
Average for_each_set_bit took: 4638.600 usec (+- 13.761 usec)
Average test_bit loop took: 1894.200 usec (+- 2.672 usec)
-
HarmonyOS NEXT调优工具Smart Perf Host高效使用指南2023-11-09 472
-
Linux perf性能、实际应用与案例2023-07-03 1483
-
如何将OpenCSD库与Yocto上的perf工具集成?2023-03-31 639
-
一文看懂Linux性能分析之perf原理2022-11-14 2651
-
perf 在内核中的实现原理2022-10-17 3884
-
全志Tina中使用perf分析CPU使用率2022-05-20 6159
-
赛昉科技发布Perf性能分析工具2022-04-24 3162
-
unit_perf基于OpenWrt的性能检测工具2022-04-21 1441
-
Linux kernel系统性能优化工具Perf介绍2022-04-15 5105
-
OpenHarmony常用的性能分析工具2022-03-21 2895
-
你知道perf学习-linux自带性能分析工具怎么用?2019-05-16 3356
全部0条评论

快来发表一下你的评论吧 !
