
FPGA二值图像边界提取算法实现
FPGA/ASIC技术
描述
1 背景知识
图1 二值图像边界提取演示
如图1 所示,图1 a为一幅简单的二值图像,经过边界提取后形成如图1 b 所示的图像,显示出了白色区域的轮廓。
2 边界提取算法
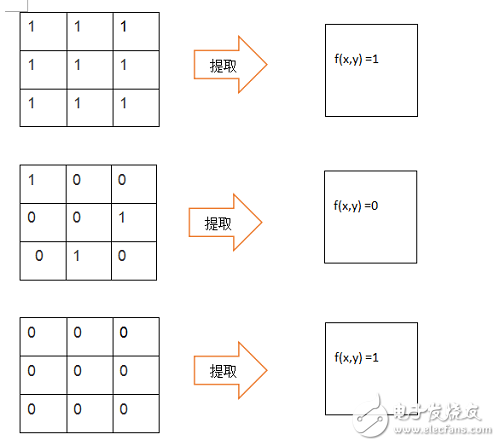
使用黑色提取,背景为白色,‘1’表示白色,‘0’表示黑色。

图2 二值图像边界提取演示
我们使用3x3模板进行边界提取,所以当3x3九个点都是‘1’的时候,输出为‘1’,当九个点都是‘0’的时候,输出为‘1’,其他情况输出均为‘0’。
3 FPGA二值图像边界提取算法实现

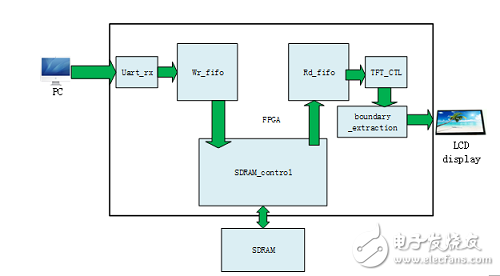
图2 二值图像膨胀FPGA模块架构
图2中我们使用串口传图传入的是二值图像。
FPGA源码:
/*
Module name: boundary_extraction.v
Description: binary image boundary extraction
*/
`timescale 1ns/1ps
module boundary_extraction(
input clk, //pixel clk
input rst_n,
input hs_in,
input vs_in,
input [15:0] data_in,
input data_in_en,
output hs_out,
output vs_out,
output reg [15:0] data_out,
output data_out_en
);
wire [15:0] line0;
wire [15:0] line1;
wire [15:0] line2;
reg [15:0] line0_data0;
reg [15:0] line0_data1;
reg [15:0] line0_data2;
reg [15:0] line1_data0;
reg [15:0] line1_data1;
reg [15:0] line1_data2;
reg [15:0] line2_data0;
reg [15:0] line2_data1;
reg [15:0] line2_data2;
reg data_out_en0;
reg data_out_en1;
reg data_out_en2;
reg hs_r0;
reg hs_r1;
reg hs_r2;
reg vs_r0;
reg vs_r1;
reg vs_r2;
wire[18:0] result_data;
line3x3 line3x3_inst(
.clken(data_in_en),
.clock(clk),
.shiftin(data_in),
.shiftout(),
.taps0x(line0),
.taps1x(line1),
.taps2x(line2)
);
//------------------------------------------------------------------------------
// Form an image matrix of three multiplied by three
//------------------------------------------------------------------------------
always @(posedge clk or negedge rst_n) begin
if(!rst_n) begin
line0_data0 <= 16'b0;
line0_data1 <= 16'b0;
line0_data2 <= 16'b0;
line1_data0 <= 16'b0;
line1_data1 <= 16'b0;
line1_data2 <= 16'b0;
line2_data0 <= 16'b0;
line2_data1 <= 16'b0;
line2_data2 <= 16'b0;
data_out_en0 <= 1'b0;
data_out_en1 <= 1'b0;
data_out_en2 <= 1'b0;
hs_r0 <= 1'b0;
hs_r1 <= 1'b0;
hs_r2 <= 1'b0;
vs_r0 <= 1'b0;
vs_r1 <= 1'b0;
vs_r2 <= 1'b0;
end
else if(data_in_en) begin
line0_data0 <= line0;
line0_data1 <= line0_data0;
line0_data2 <= line0_data1;
line1_data0 <= line1;
line1_data1 <= line1_data0;
line1_data2 <= line1_data1;
line2_data0 <= line2;
line2_data1 <= line2_data0;
line2_data2 <= line2_data1;
data_out_en0 <= data_in_en;
data_out_en1 <= data_out_en0;
data_out_en2 <= data_out_en1;
hs_r0 <= hs_in;
hs_r1 <= hs_r0;
hs_r2 <= hs_r1;
vs_r0 <= vs_in;
vs_r1 <= vs_r0;
vs_r2 <= vs_r1;
end
end
//-------------------------------------------------------------------
// line0_data0 line0_data1 line0_data2
// line1_data0 line1_data1 line1_data2
// line2_data0 line2_data1 line2_data2
//--------------------------------------------------------------------
always @(posedge clk or negedge rst_n) begin
if(!rst_n)
data_out <= 16'h0000;
else if(data_out_en1)
if((line0_data0 == 16'h0000) && (line0_data1 == 16'h0000) && (line0_data2 == 16'h0000) && (line1_data0 == 16'h0000) && (line1_data1 == 16'h0000) && (line1_data2 == 16'h0000) && (line2_data0 == 16'h0000) && (line2_data1 == 16'h0000) && (line2_data2 == 16'h0000))
data_out <= 16'hffff;
else if((line0_data0 == 16'hffff) && (line0_data1 == 16'hffff) && (line0_data2 == 16'hffff) && (line1_data0 == 16'hffff) && (line1_data1 == 16'hffff) && (line1_data2 == 16'hffff) && (line2_data0 == 16'hffff) && (line2_data1 == 16'hffff) && (line2_data2 == 16'hffff))
data_out <= 16'hffff;
else
data_out <= 16'h0000;
end
endmodule
4实验结果

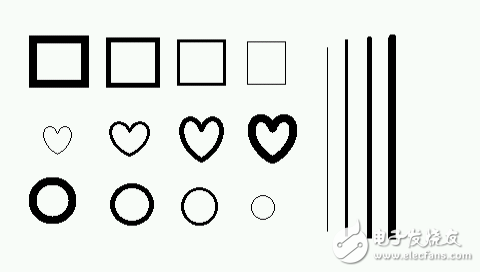
图5 实验原图1
图6实验原图2
图7 实验结果图1
图8 实验结果图2
结果分析:图5和图7对比,比较粗的线都被查找出了边缘,只有最细的那条没有被提取出来,并且被加粗,原因是最细的线条只有三个像素当查找出边缘后显示为黑色,两边黑色连在一起所以线条就变粗了。图6和图8边缘查找没有问题。
- 相关推荐
- 热点推荐
- FPGA
-
在FPGA上跑二值图像膨胀算法程序代码2018-03-14 3368
-
基于FPGA的腐蚀膨胀算法实现2017-09-22 6650
-
基于FPGA的二值图像的边界提取算法的实现2018-08-10 3090
-
基于FPGA的二值图像的膨胀算法的实现2018-08-14 3107
-
【工程源码】基于FPGA的数字识别的实现2020-02-17 3268
-
一种二值图象边界提取算法2009-05-27 579
-
基于边界特征的图像二值化方法应用研究2009-11-08 895
-
基于FPGA的二值图像连通域标记快速算法实现2009-11-30 920
-
二值图像目标邻域点法边界跟踪算法2011-05-25 1326
-
ECT图像重建算法的FPGA实现2015-11-19 882
-
CCD图像的颜色插值算法研究及其FPGA实现2016-08-29 589
-
二值图像 FPGA腐蚀算法解析2018-03-21 5780
-
基于FPGA的图像差分处理2018-04-06 7778
-
利用FPGA实现快速二值图像连通域标记算法,有何特点及应用2018-11-14 7675
-
基于FPGA的图像旋转和双线性插值算法设计2023-09-04 3074
全部0条评论

快来发表一下你的评论吧 !

