

如何使用OFF-CPU火焰图调查分析Linux性能问题概述
描述
本文用off-cpu火焰图分析一个程序的延迟(主要在拿锁上),找出来瓶颈,并消除的故事。本文非常值得一读,但是阅码场没有足够的时间将其翻译为中文,希望童鞋们直接读英文。
The Setup
As a performance engineer at MemSQL, one of my primary responsibilities is to ensure that customer Proof of Concepts (POCs) run smoothly. I was recently asked to assist with a big POC, where I was surprised to encounter an uncommon Linux performance issue. I was running a synthetic workload of 16 threads (one for each CPU core). Each one simultaneously executed a very simple query (select count(*) from t where i > 5) against a columnstore table.
In theory, this ought to be a CPU bound operation since it would be reading from a file that was already in disk buffer cache. In practice, our cores were spending about 50% of their time idle
In this post, I’ll walk through some of the debugging techniques and reveal exactly how we reached resolution.
What were our threads doing?
After confirming that our workload was indeed using 16 threads, I looked at the state of our various threads. In every refresh of my htop window, I saw that a handful of threads were in the D state corresponding to “Uninterruptible sleep”:

Why were we going off CPU?
At this point, I generated an off-cpu flamegraph using Linux perf_events to see why we entered this state. Off-CPU means that instead of looking at what is keeping the CPU busy, you look at what is preventing it from being busy by things happening elsewhere (e.g. waiting for IO or a lock). The normal way to generate these visualizations is to use perf inject -s, but the machine I tested on did not have a new enough version of perf. Instead I had to use an awk script I had previously written:
$ sudoperfrecord --call-graph=fp -e 'sched:sched_switch' -e 'sched:sched_stat_sleep' -e 'sched:sched_stat_blocked' --pid $(pgrep memsqld | head -n 1) -- sleep 1
[ perf record: Woken up 1 times to write data ]
[ perf record: Captured and wrote 1.343 MB perf.data (~58684 samples) ]
$ sudoperfscript -f time,comm,pid,tid,event,ip,sym,dso,trace -i sched.data | ~/FlameGraph/stackcollapse-perf-sched.awk | ~/FlameGraph/flamegraph.pl --color=io --countname=us >off-cpu.svg
Note: recording scheduler events via perf record can have a very large overhead and should be used cautiously in production environments. This is why I wrap the perf record around a sleep 1 to limit the duration.
In an off-cpu flamegraph, the width of a bar is proportional to the total time spent off cpu. Here we see a lot of time is spent in rwsem_down_write_failed.
From the repeated calls to rwsem_down_read_failed and rwsem_down_write_failed, we see that culprit was mmapcontending in the kernel on the mm->mmap_sem lock:
down_write(&mm->mmap_sem);
ret = do_mmap_pgoff(file, addr, len, prot, flag, pgoff,&populate);
up_write(&mm->mmap_sem);
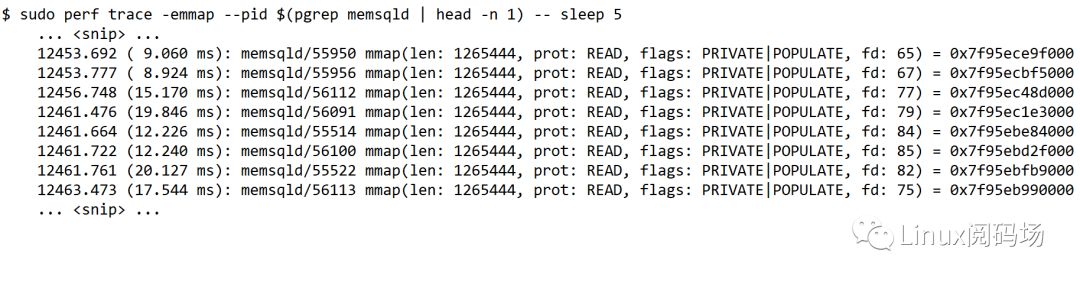
This was causing every mmap syscall to take 10-20ms (almost half the latency of the query itself). MemSQL was so fast that that we had inadvertently written a benchmark for Linux mmap!
The fix was simple — we switched from using mmap to using the traditional file read interface. After this change, we nearly doubled our throughput and became CPU bound as we expected:
For more information and discussion around Linux performance, check out the original post on my personal blog.
Download MemSQL Community Edition to run your own performance tests for free today: memsql.com/download
Alex Reece is a systems and performance engineer. He believes in active benchmarking, root cause analysis, and fast code.
-
Linux性能分析工具大全2023-01-05 1041
-
中国锂离子电池原材料市场调查分析报告2008-2009版2008-12-29 3166
-
_首届中国嵌入式应用状况_调查分析报告2012-08-20 1825
-
全志Tina中使用perf分析CPU使用率2022-05-20 6107
-
火焰识别2022-07-23 5770
-
Linux CPU的性能应该如何优化2020-01-18 4318
-
疫情之下,中国LED显示屏市场活力调查分析2020-04-02 2168
-
火焰图系列之使用火焰图隐藏功能提高绘制精度2020-06-23 2588
-
火焰图:全局视野的Linux性能剖析2020-06-28 2719
-
杀手级分析——bootchart2020-09-08 8734
-
基于linux eBPF的进程off-cpu的方法2020-09-25 4010
-
Linux问题分析与性能优化2021-09-06 1632
-
Linux问题故障定位的小技巧2023-07-09 926
-
使用Arthas火焰图工具的Java应用性能分析和优化经验2024-10-28 2395
-
Linux性能分析实战:用trace揪出卡顿、高CPU的“真凶”2026-02-03 613
全部0条评论

快来发表一下你的评论吧 !
