
资料下载

使用LM35温度传感器监测食品行业冷库的温度
描述
本项目将使用LM35温度传感器监测食品行业冷库的温度。冷藏单元的预定义阈值温度值由操作员设置。在 PyCharm 软件的帮助下,当前值显示在监视器上。如果超过阈值温度,则会通过 Twilio 向用户发送 SMS 警报以及存储单元的当前温度读数值。此外,LED 的点亮和蜂鸣器发出的蜂鸣声提醒周围的人员或操作员。温度传感器发送的数据存储在 Bolt Cloud 中,这有助于使用机器学习随时间进行温度预测。Z-Score 分析有助于检测温度的任何突然变化。
电路连接
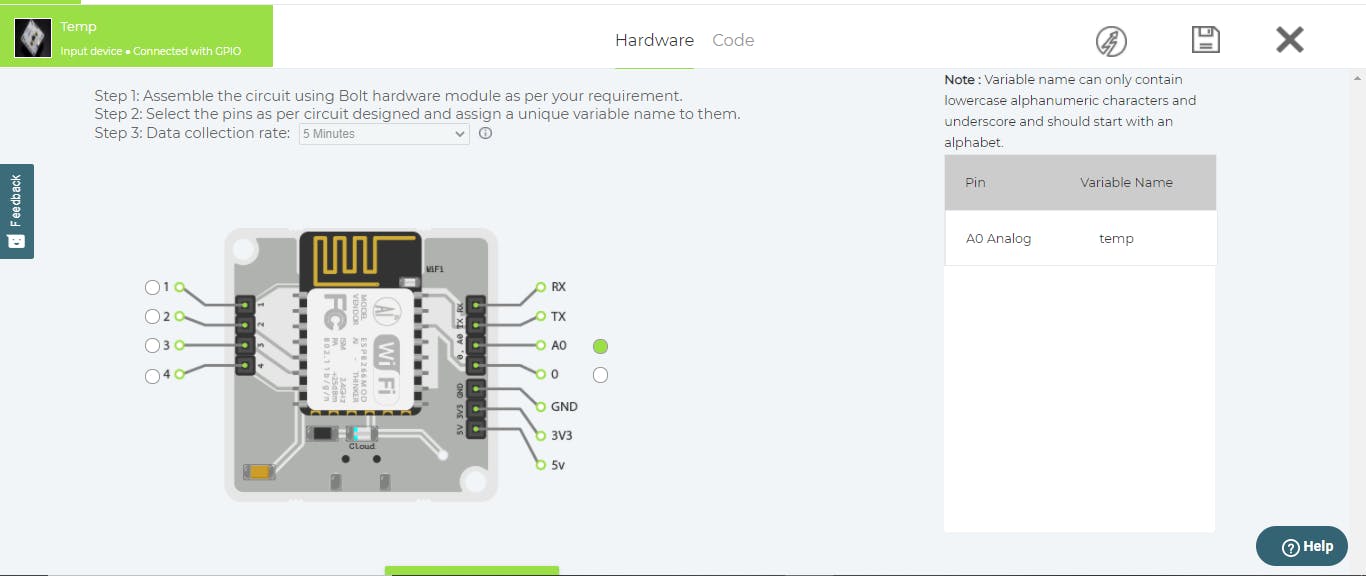
1 、LM 35温度传感器是本项目的主要单元。LM35 传感器为 A0 引脚提供模拟输入。Bolt 内置了模数转换器 (ADC),可将此模拟值转换为数字值。然后这个数字值被发送到 Bolt Cloud。
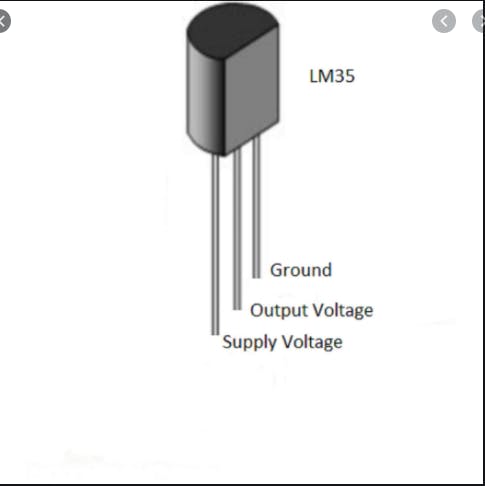
握住 LM35 传感器,使传感器上写有 LM35 文字的平面朝向您。在此配置中,左侧引脚为VCC ,中间引脚为V 输出,右侧引脚为接地引脚。
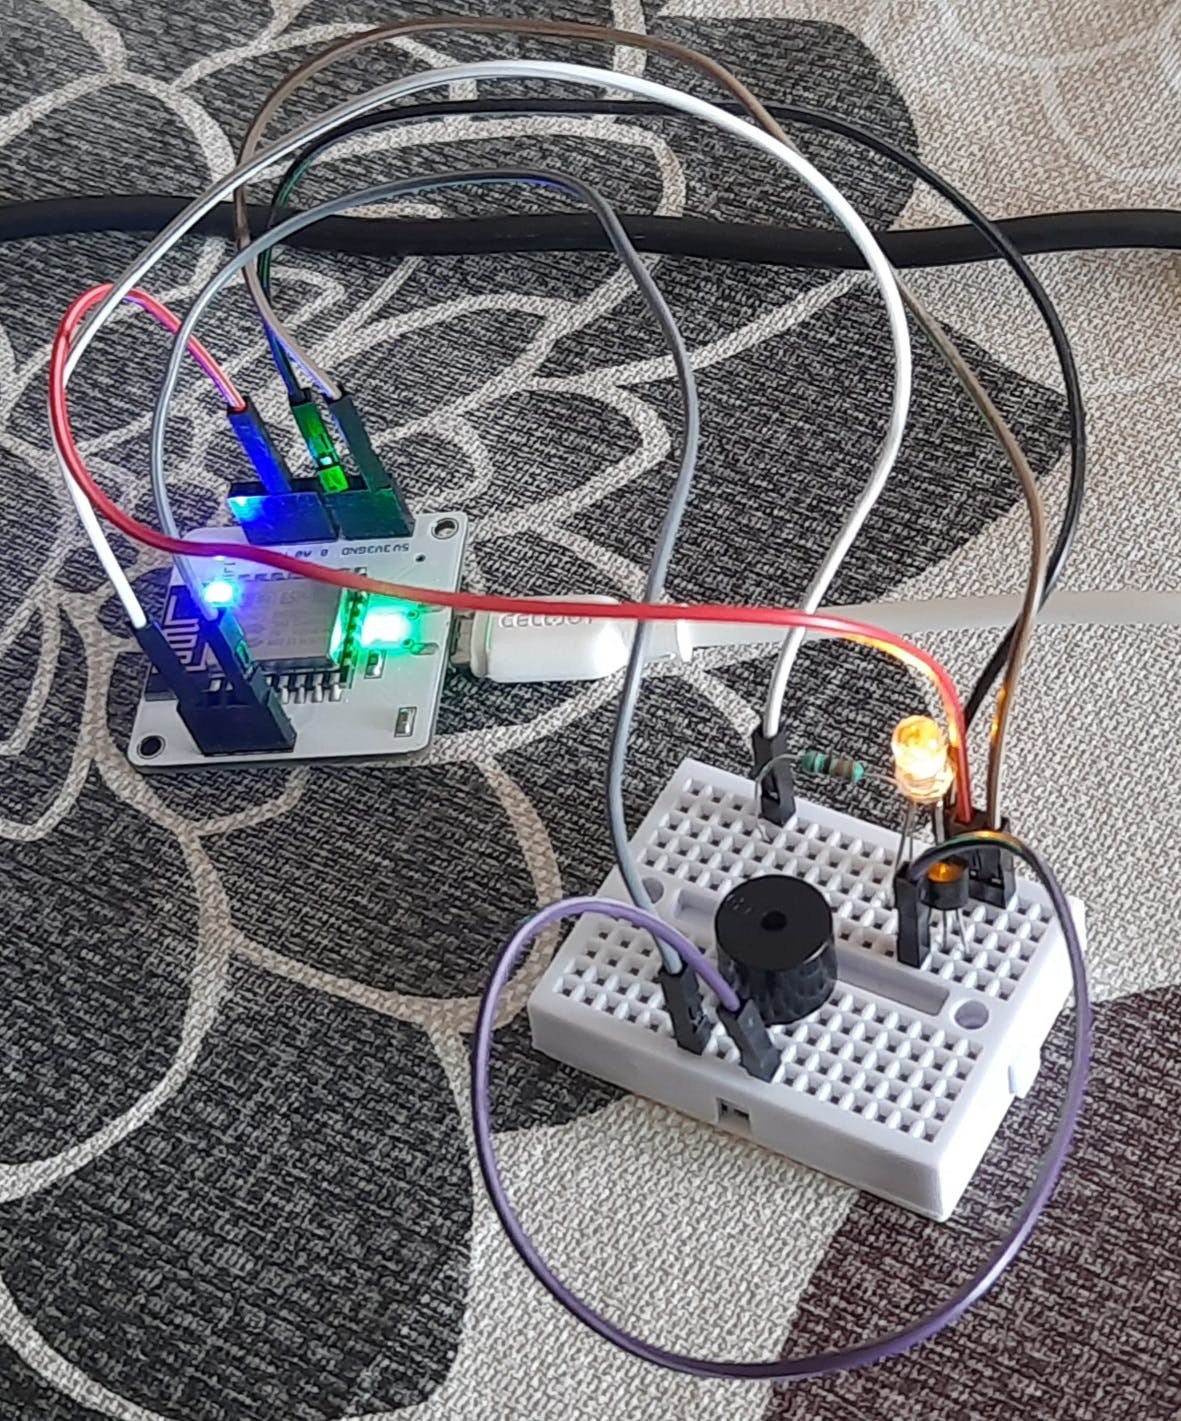
连接面包板上的 LM35 传感器。公头/公头跳线用于将 VCC 连接到 Bolt wifi 模块的5V 引脚,V 输出连接到A0 引脚,将 LM35 的接地引脚连接到 Bolt wifi 模块的接地引脚 (GND) 。
2. LED 的短腿连接到面包板上的GND 引脚,而较长的腿连接到串联的 330ohm 电阻的一端。电阻的另一端使用公/公跳线连接到GPIO (通用输入/输出)引脚 1 。
3. Buzzer的长短脚分别通过公/公跳线连接到GPIO 引脚 4和GND 引脚。
4.最后,使用 USB-A 转 Micro-USB 电缆将 Bolt wifi 模块连接到笔记本电脑/个人电脑/充电器,以便通电。

设备
完整的电路
设置 ProductOnBolt Cloud
1.设置 Bolt wifi 模块。
2.在这里,您将找到您的 Bolt API 密钥和 Bolt 设备 ID。保存。
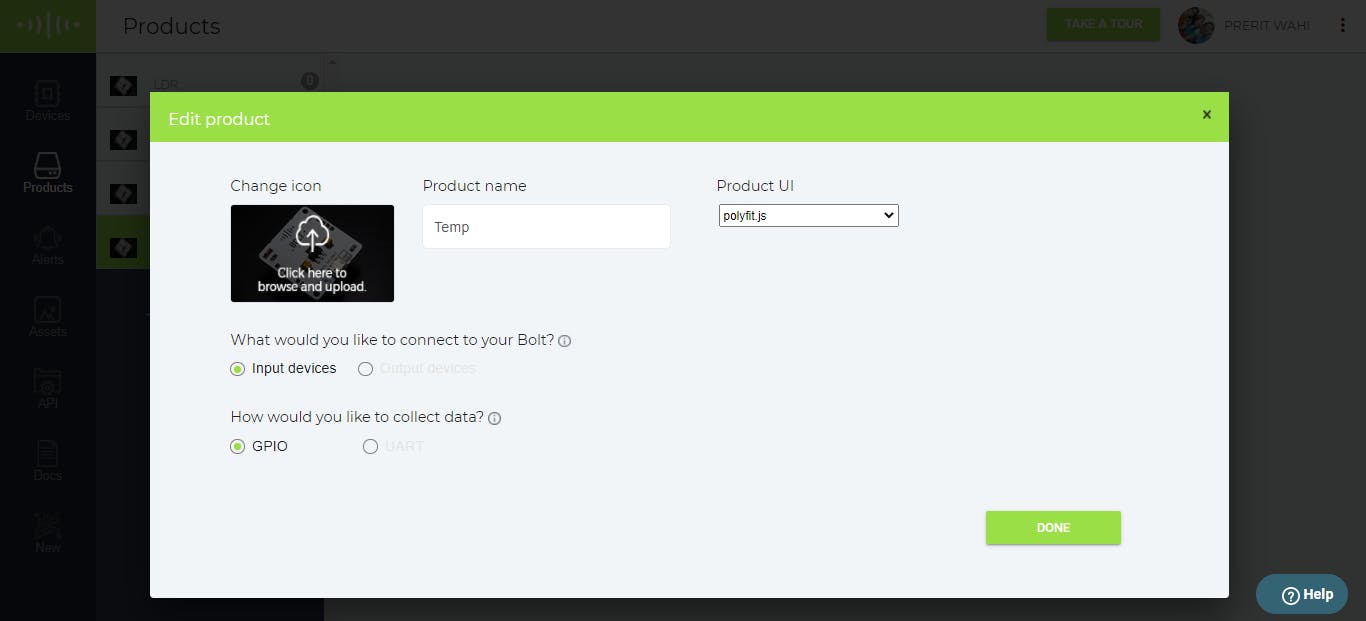
3.转到 PRODUCTS 并制作一个新产品,为其命名并选择如下所示的选项,然后单击 DONE。
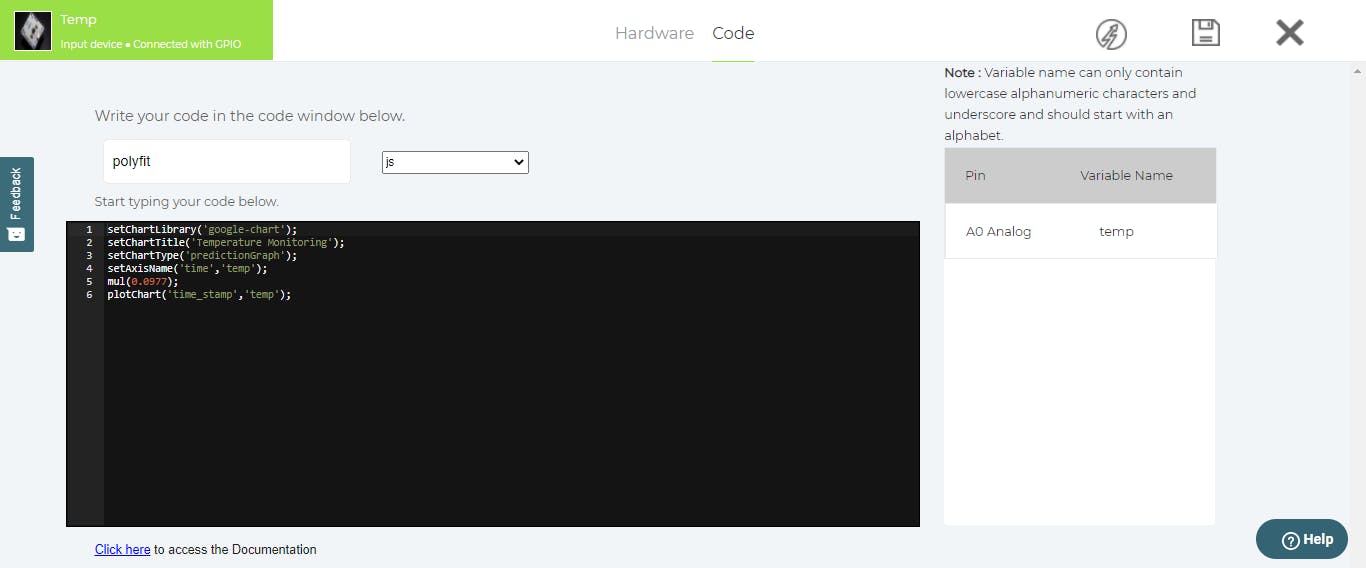
4.进入配置,然后设置硬件并编写预测温度的代码,然后保存。
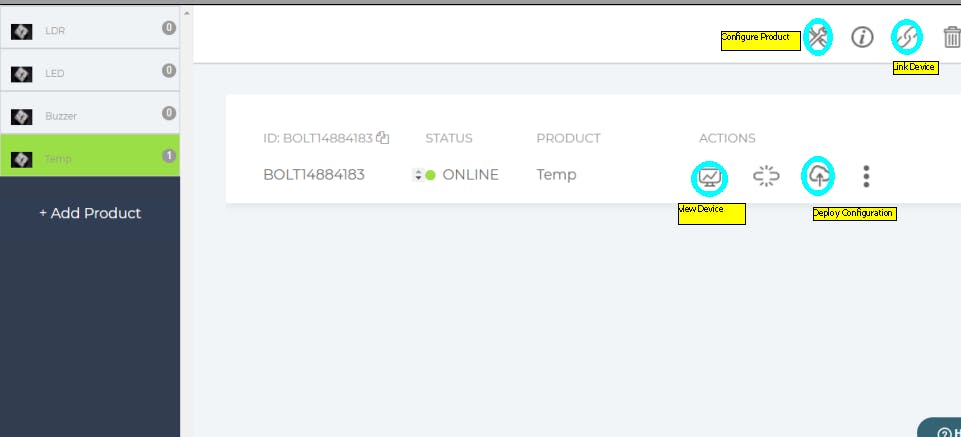
5.将产品链接到设备并部署配置。
制作 TWILIO 帐户
Twilio 是第三方 SMS 功能提供商。它是一家云通信平台即服务 (PaaS) 公司。Twilio 允许软件开发人员以编程方式拨打和接听电话,还可以使用其 Web 服务 API 发送和接收文本消息。
1.使用您的邮件 ID 和页面上提供的其他详细信息进行注册。然后 Twilio 将在您的邮件 ID 上发送一封验证邮件,该邮件必须经过验证。

2.然后提供将发送 OTP 的手机号码进行验证。
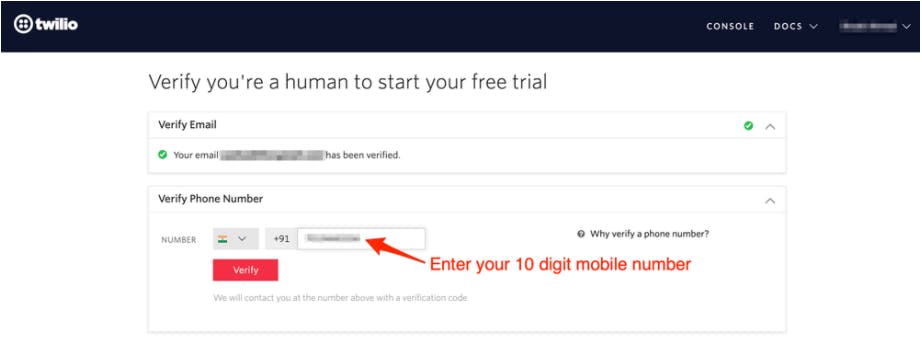
现在,您已入职。回答几个问题,如下所示。
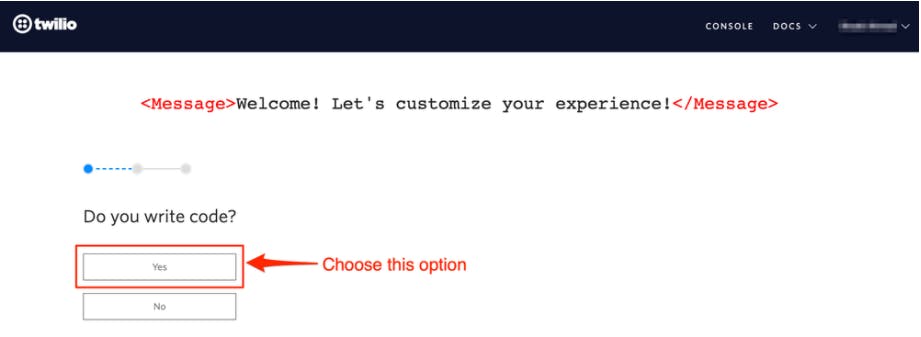
3.对于编码,选择“是”。然后选择您喜欢的编码语言。我选择 Python。对于目标,选择“在项目中使用 Twilio”。对于消息传递,请从下面给出的选项中进行选择。我为我的项目选择了SMS 。
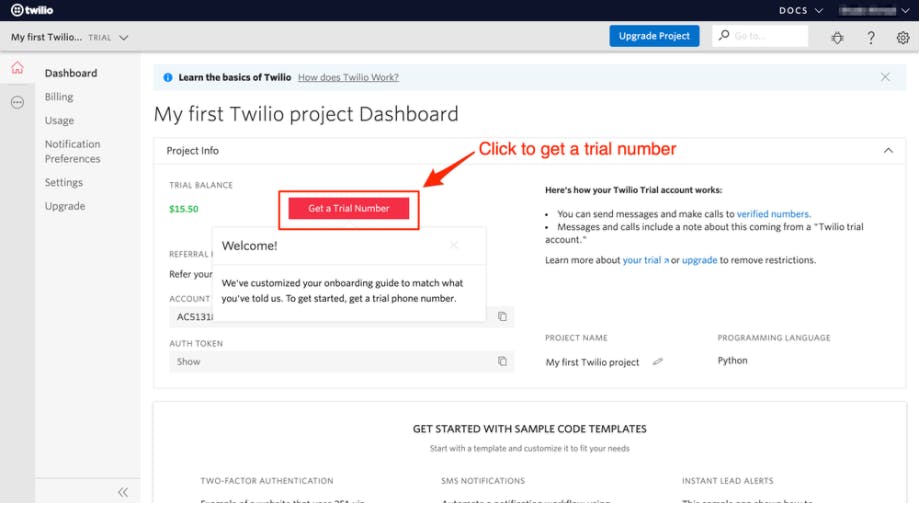
4.现在,转到 Twilio Dashboard 并选择将提供试用号的选项。选择那个号码。该号码将与您联系。
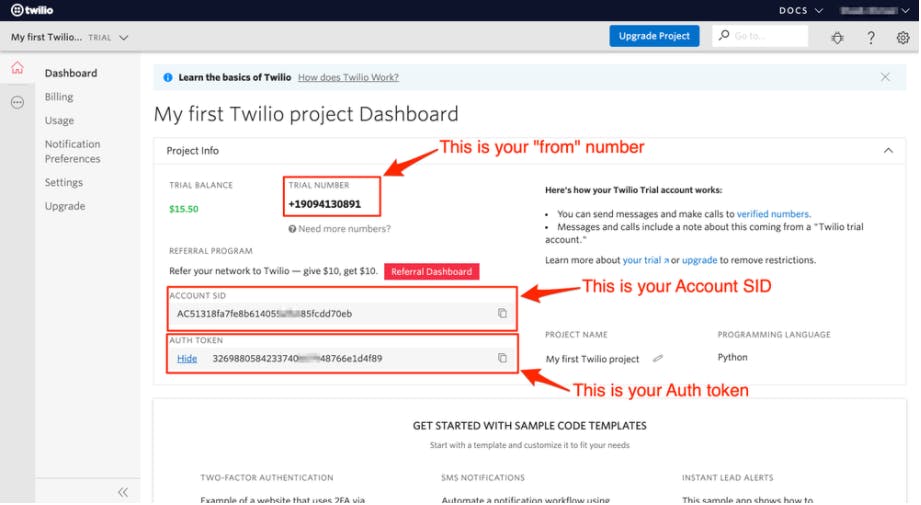
5.最后,您将在 Twilio Dashboard 上获得您的 Account SID、Auth Token、您的手机号码和试用号。保存。
下载并安装 PYCHARM
PyCharm is an integrated development environment (IDE) used in computer programming, specifically for the Python language. It is developed by the Czech company JetBrains.It provides code analysis, a graphical debugger, etc. and supports Data Science with Anaconda. PyCharm is cross-platform, with Windows, macOS and Linux versions.
1. Download PyCharm by visiting http://www.jetbrains.com/pycharm/ and click DOWNLOAD (shown in black). Then select the type of OS you have and then download either OPEN SOURCE (COMMUNITY) which is completely free or PROFESSIONAL which is for free trail. I took open source. Then click Download button and wait for it to download.

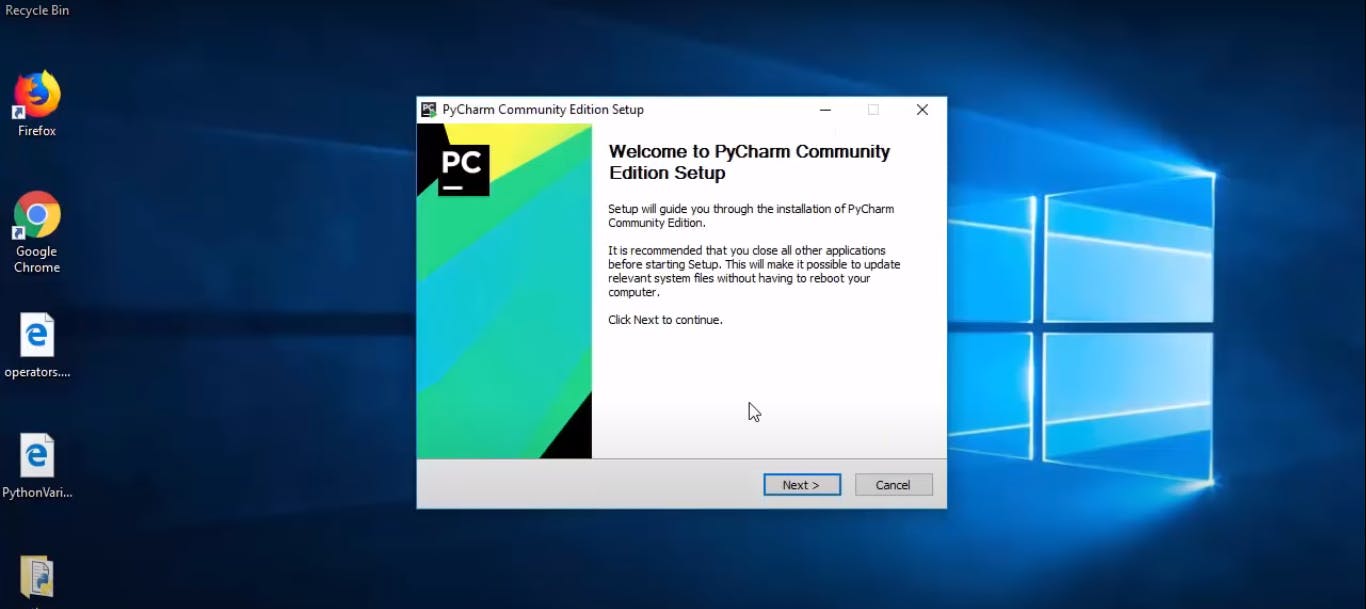
2. When it gets downloaded. Double click the file stored on your computer. Then follow the steps shown in the images below to install PyCharm.
3. Click NEXT. Select the folder where you want to install PyCharm. Select 64 bit launcher. Create a folder with name 'JetBrains'. Wait for PyCharm to install.
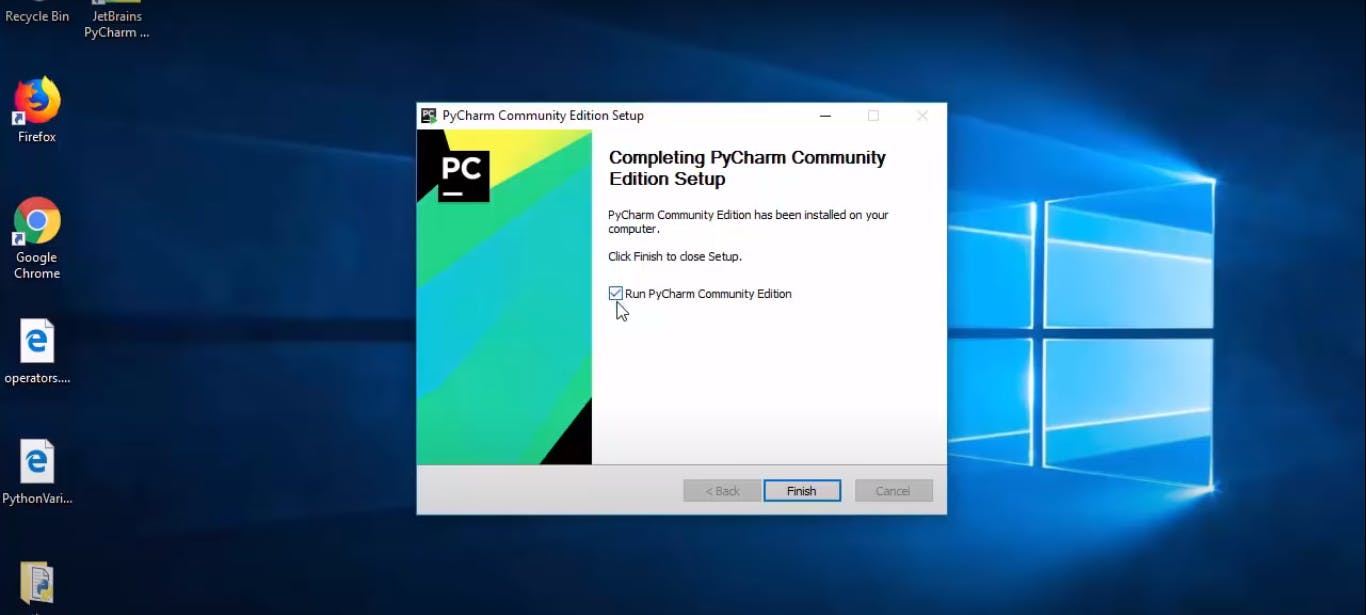
4. Click FINISH once installed. Click OK for 'Do not import settings'. Accept the terms and con5.ditions shown. Finally, click on 'Don't send'.
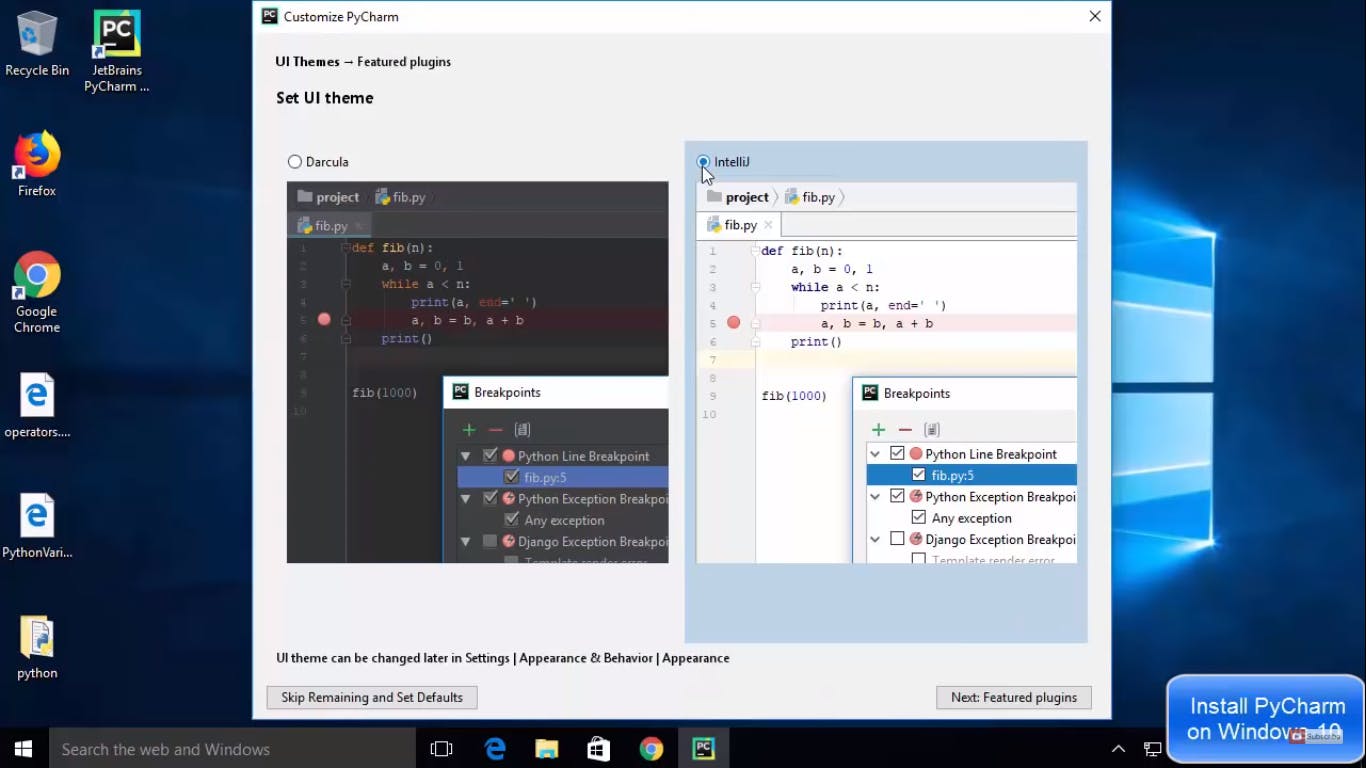
5. Now, open PyCharm. Select the screen colour DARCULA or INTELLIJ. Skip the next step (If you want, you can install UI themes as also). Then, wait for PyCharm to load. Then select the option CreateNewProject. Then give a name to your project. Make a new file as shown below and name it. Then you can start with your coding.
THEORY
Z-SCORE ANALYSIS
Z-scoreanalysis is used for anomaly detection i.e. anything outside of normal. When temperature increases or decreases suddenly, it is called anomaly and Z-score analysis detects this. Upper and lower bounds are found out using multiplication factor, frame size and input values from LM 35 sensor.
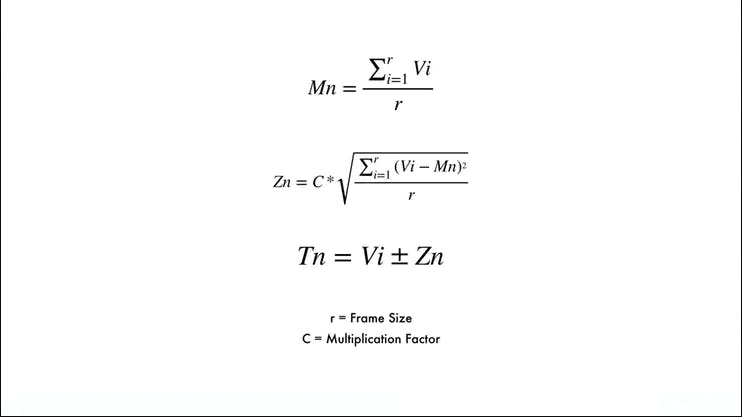
Mn is the mean of input data collected. Vi is the variance, r is the frame size i.e. number of input data points collected. I have collected 5 data points. C is the multiplication factor which is taken as 3 in my project. Tn gives the upper and lower threshold depending on + and - respectively in the formula shown.
WORKING
LM 35 sensor collects data every 5 minutes and sends it to Bolt Cloud.
I placed the setup in open for getting normal temperature. Then I put the setup in cold area quickly so that temperature decreases suddenly.
Then again, I placed the setup in open for normal temperature. Then, I took the setup in a hot area quickly so that temperature rise is quick.
The code checks if the temperature is within threshold limits or not by using data from LM 35 sensor. If it isn't in the limits, then Twilio sends the message on our mobile regarding threshold getting crossed.
The code also checks if there is sudden change in temperature (increase or decrease) beyond the upper and lower bounds. If there is, then Twilio sends the message on our mobile regarding sudden change in temperature.
Prediction graphs gets plotted using data from LM35 sensor to predict temperature in near future using machine learning. Sudden changes were made to temperature values to see the affect on the prediction.
The detailed explanation of code is given along with the code itself.
PREDICTIONGRAPH
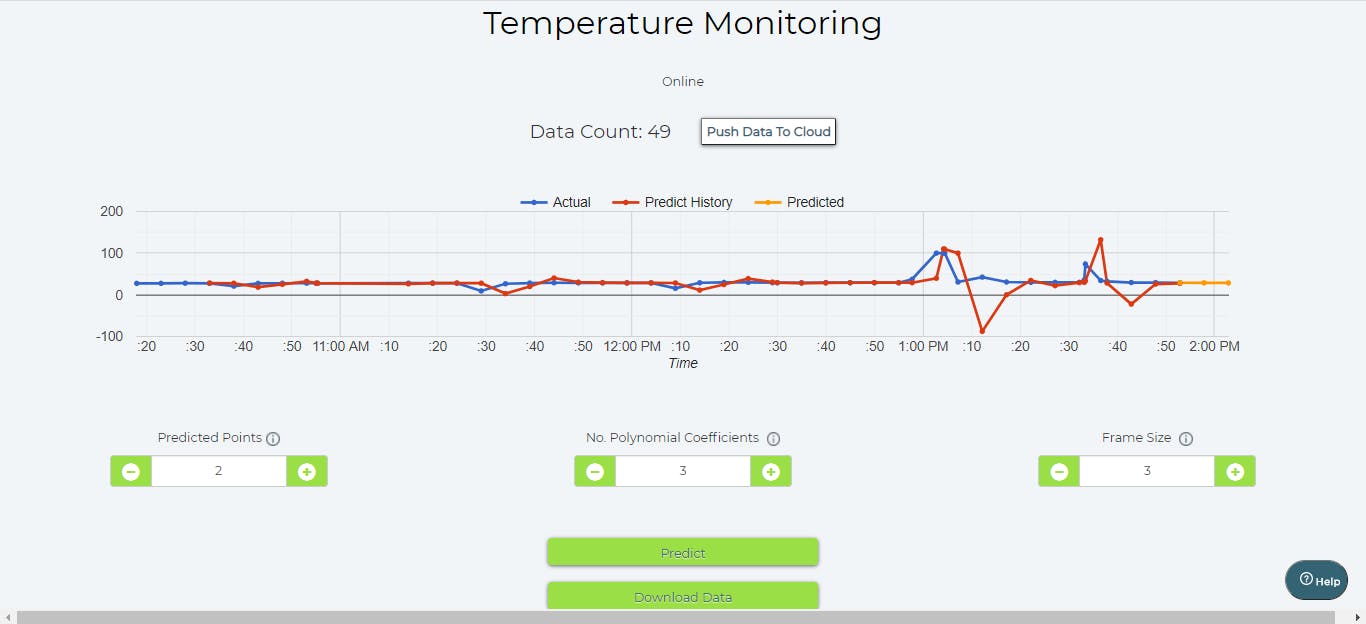
PredictedPoints shows number of future data points of temperature taht need to be predicted. No. of Polynomial Coefficients (value of n) indicates how many coefficients or elements should be present in the function. Number of polynomial coefficients decide the nature of predict history graph (shown in red). This graph gets plotted based on the nature of actual graph (shown in blue) and no. of polynomial coefficients. It helps to tune the machine learning model. Frame size indicates how many points on actual graph should be taken into consideration for plotting predict history graph. Predicted Graph (shown in blue) shows the value and nature of future data points and graphs respectively. The 3 parameters shown in the figure have to changed and set such that predicted data most closely imitates the actual data. This lead to future data being most accurate.

OUTPUT
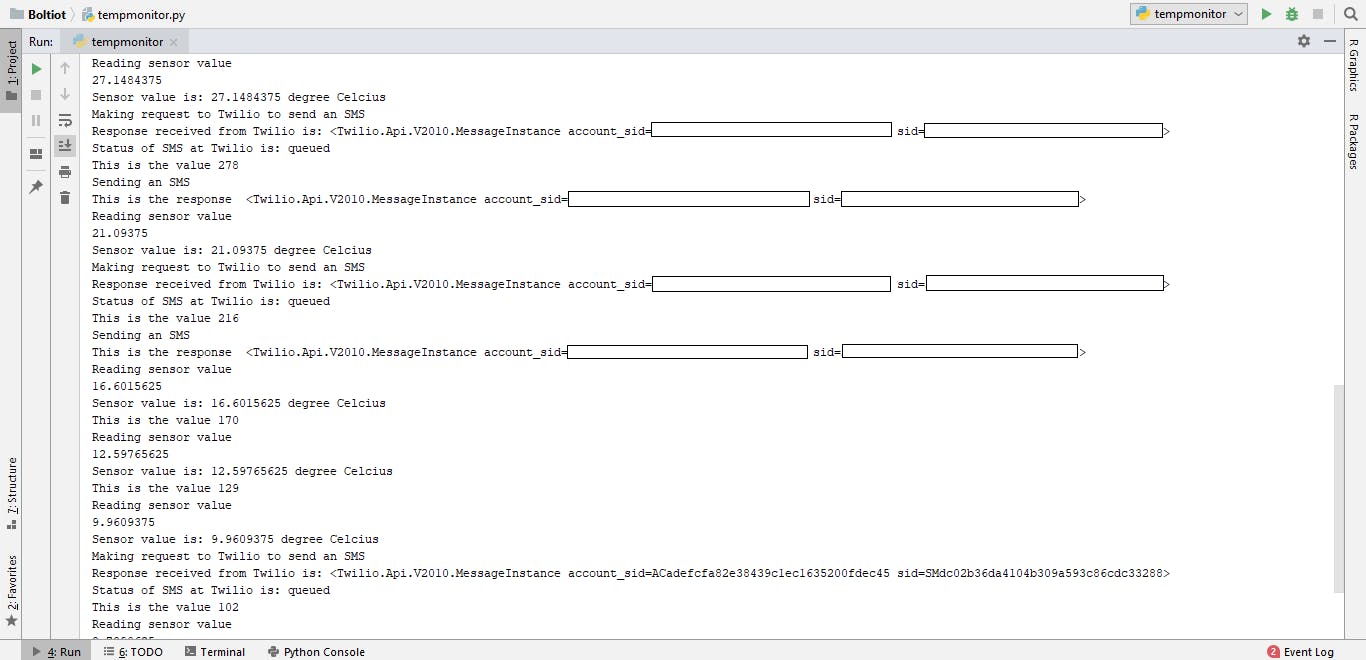
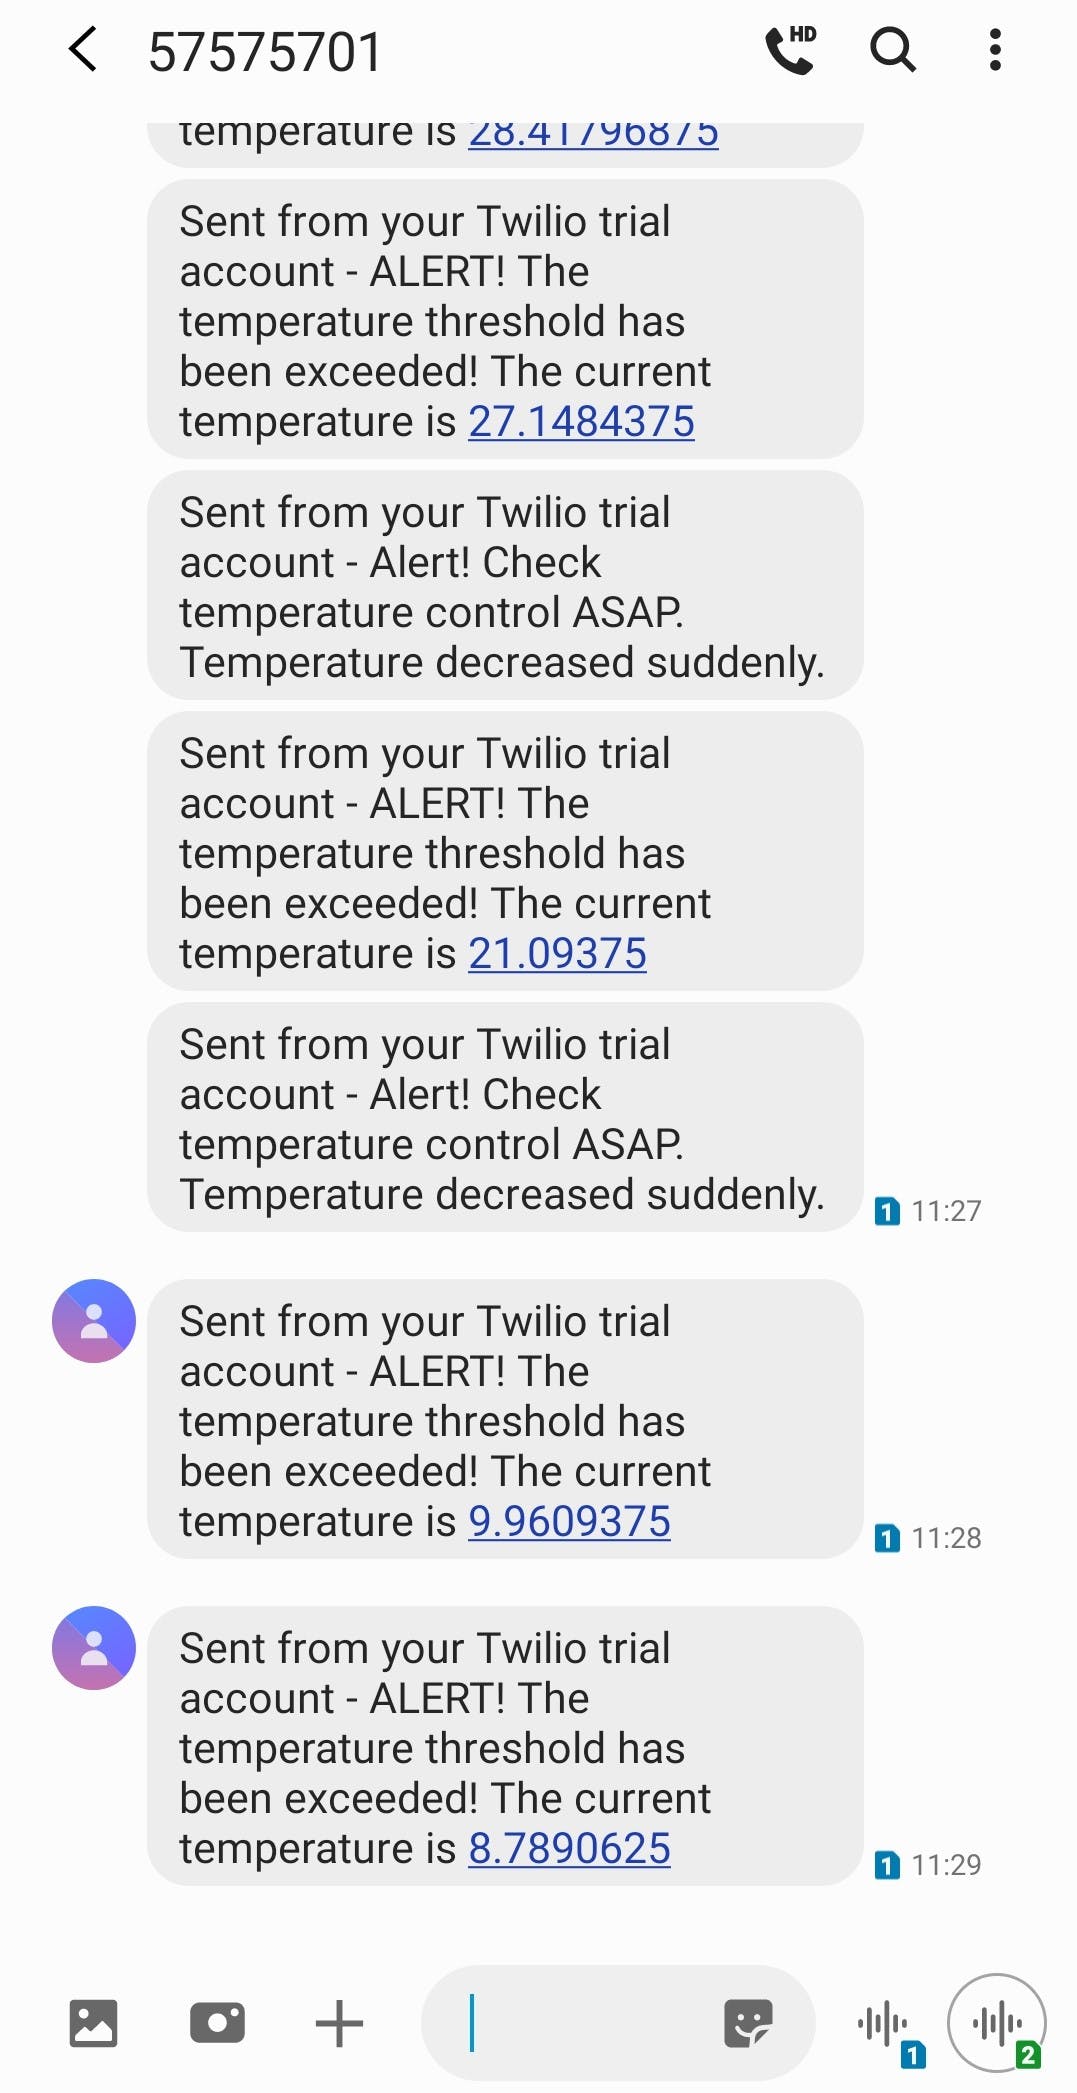
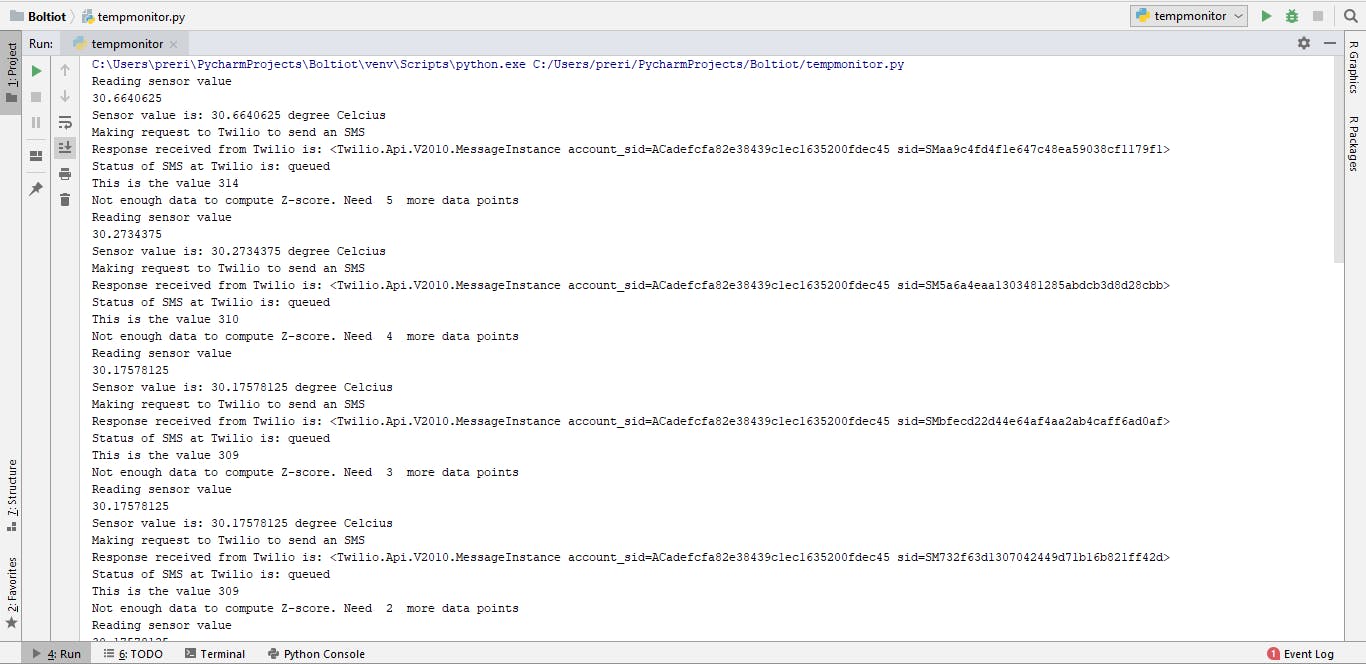
CodedOutputRegardingThresholdCrossing and Sudden Decrease in Temperature
MessageRegardingThresholdCrossing and Sudden Decrease in Temperature
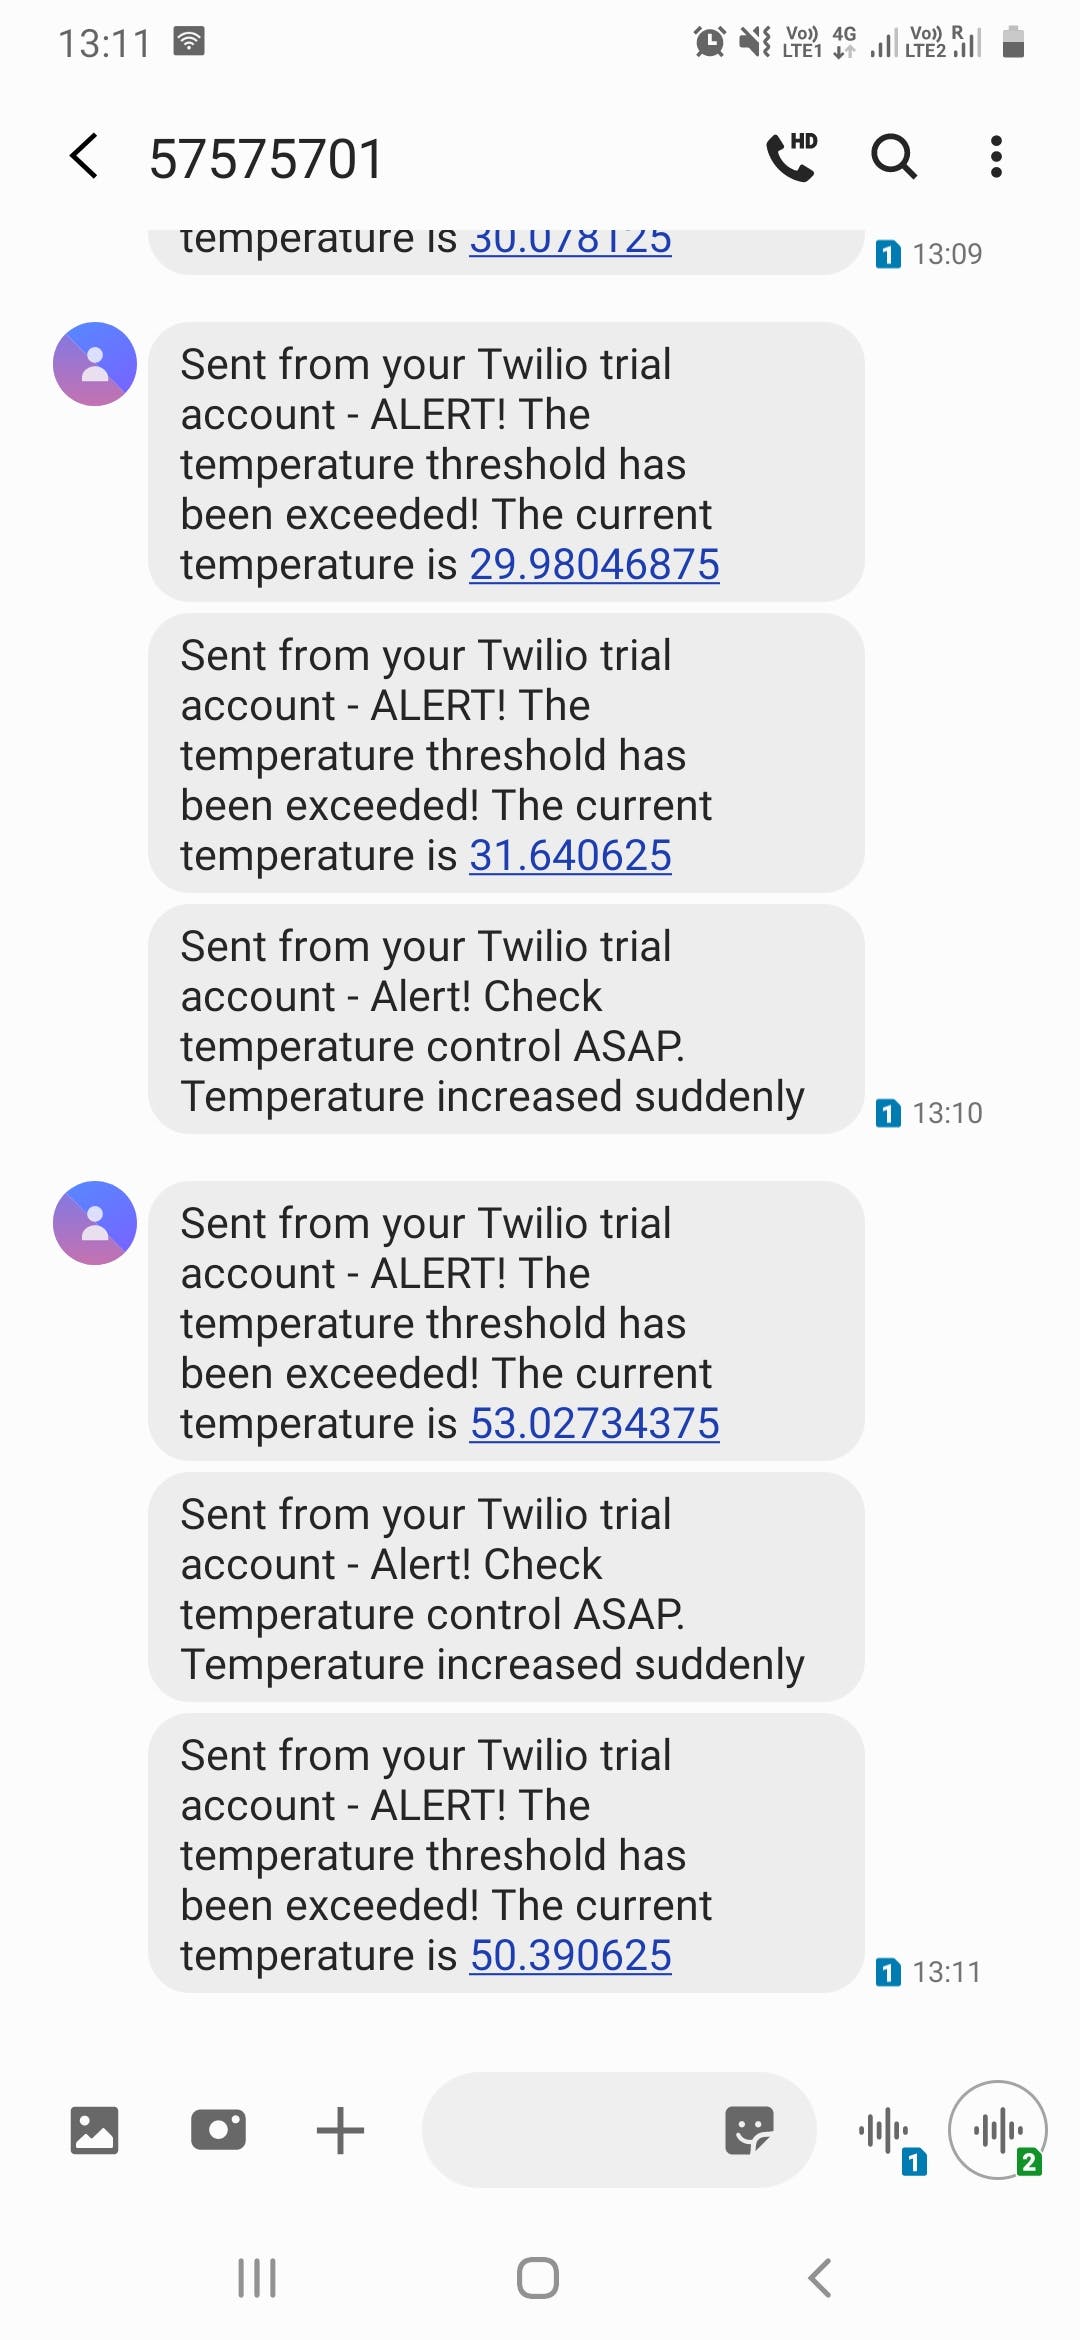
CodedOutputRegardingThresholdCrossing and Sudden Increase in Temperature
MessageRegardingThresholdCrossing and Sudden Decrease in Temperature
声明:本文内容及配图由入驻作者撰写或者入驻合作网站授权转载。文章观点仅代表作者本人,不代表电子发烧友网立场。文章及其配图仅供工程师学习之用,如有内容侵权或者其他违规问题,请联系本站处理。 举报投诉
- 相关下载
- 相关文章


